Plot Viewer
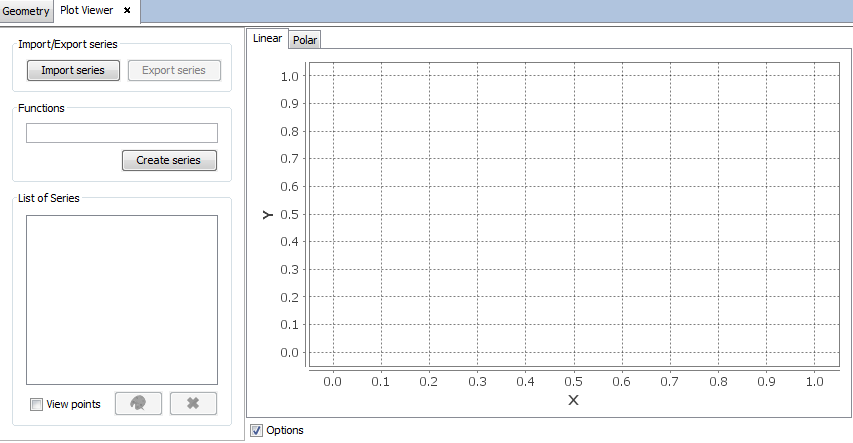
Figure 1. Plot Viewer
This tool enables the user to visualize graphic series saved from previous calculations.
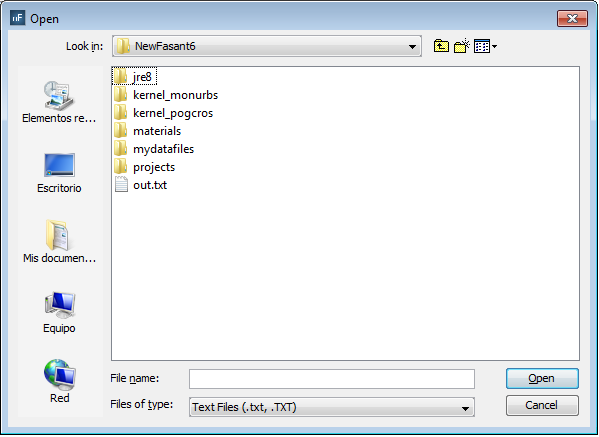
Figure 2. Import Serie
- Each point to be plotted is defined by its X and Y coordinate.
- Every points to be plotted must be defined in separated lines.
-5 -0.1
-4 -0.2
-3 -0.05
-2 0.075
-1 1.02
0 1.85
1 2.05
2 0.75
3 0
After importing this file, a new serie is added in the List of Series and its curve is plotted. Having a plot within the List of Series, a new serie may be added by applying any mathematical operation to the original one with the Functions section.
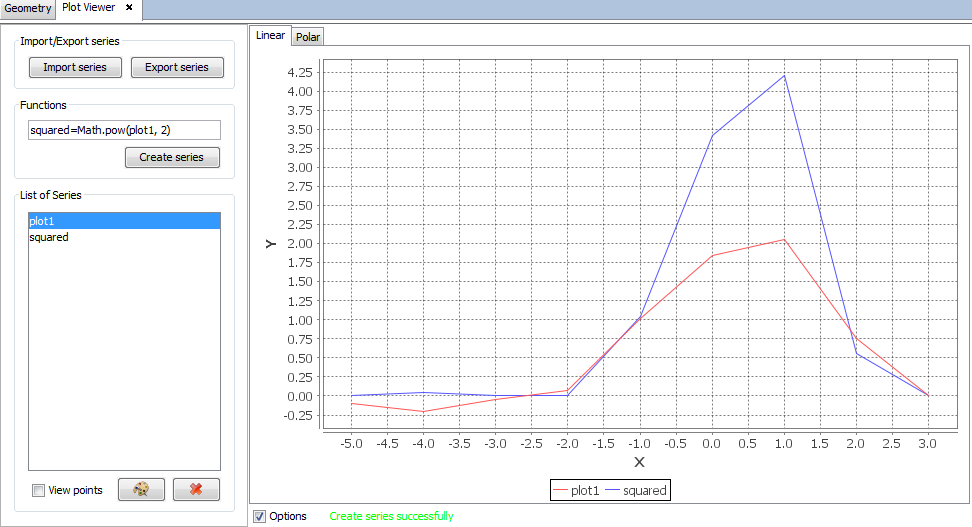
Figure 3. Plot Viewer example
It is also possible to export the modified graph by clicking on Export serie, showing an analogous window.
In visualization it is possible to see the points of the graphic with View Points and change the color of the selected graph with the button Change Color.
Under this menu it is possible to see a list of series that have been imported and can be removed with the Remove button after being selected.
In other part of the window two display modes can be chosen for the representation of the imported series: Linear and Polar.