Adjust Plot View
Adjust the plot view to analyze the material property data.
-
Choose one of the following:
- Double-click the material.
- Hover over a material, click

A window opens to the right.By default, the Info tab displays the general information of the selected material.Note: Click to view the material information in a full
screen mode.
to view the material information in a full
screen mode. -
Select the required material data under the Plots list.
The selected material data is displayed as a plot.Hover over the plot, as you move the cursor, the X and Y values are displayed.
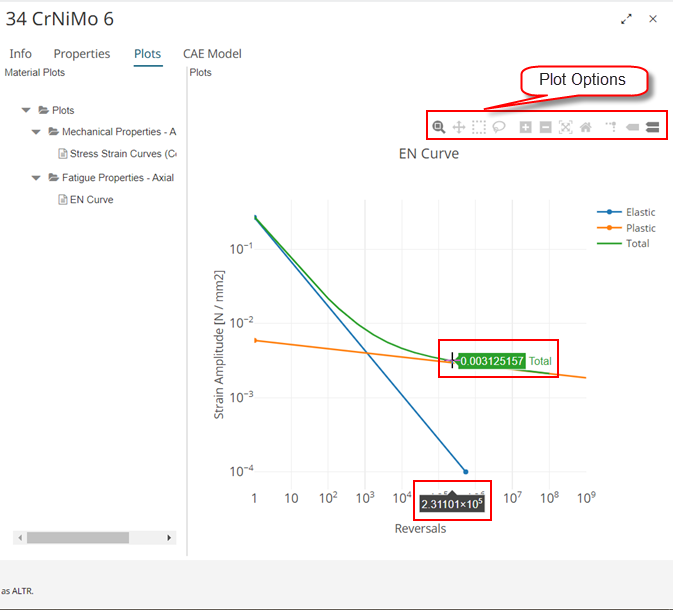
Figure 1. Plot DetailsAs you move the cursor on the plot, the plot options menu is displayed. The following table explains the usage of plot options:
Icon Description 
By default, Zoom is enabled to zoom in and zoom out. 
Click to pan the plot curves. 
Click to zoom in the plot curves. 
Click to zoom out the plot curves. 
Click to auto scale the plot curves view. 
Click to reset the axes of a plot. 
Click to toggle vertical and horizontal lines across the entire plot area on hover. 
Click to view the closet data value on a curve. 
Click to compare data values on all the curves in a plot.