A primary desire when creating a Fit is to construct it
with high predictive accuracy. HyperStudy provides several metrics which
can be used to quantitatively judge the quality of a Fit.
Selecting a Fit based on observing how the metrics perform on
the input data is simple, but may result in overfitting the model.
Tip: These metrics are presented in the Post Processing step, Diagnostic tab
of the Fit.
Overfitting describes the phenomena of a Fit with very high
input data diagnostics, but the Fit results in inaccurate
predictions when presented with new data. Essentially, the model has been tuned to be
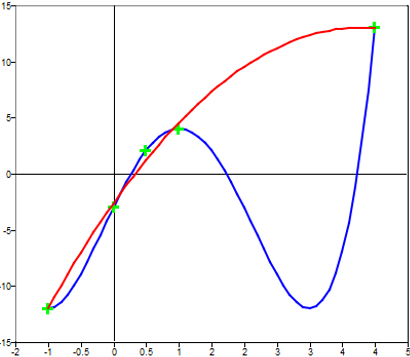
too specific to the exact input data. Figure 1. Difference between Two Curves Fitting the Same Data Points. The blue curve produces the exact values of the green data points, while the
red curve captures the data trend without capturing small deviations in the
original data. In most cases the red curve will generalize to new data better
than the overfit blue curve.
To avoid overfitting, a Fit is trained with three
conceptually unique sets of data. Input data is used to build a Fit, validation data is used to tune and compare different
Fit options, and the testing data is used in a final
step to quantify the predictive ability to unseen data.
Note: Test data is never used in
the construction and tuning of the Fit.
In
HyperStudy, testing data is optional and the validation data is
automatically constructed from the input data using a technique known as k-fold cross
validation.
This technique begins with the input data and segments it into multiple folds (or
groups). Imagine having 10 data points and 3 folds, the folding may look like:
Fold #
Run #
1
1,4,7,10
2
2,5,8
3
3,6,9
A fold is first withheld and a response surface is built using the remaining data.
The prediction is then tested on data from the withheld fold. In this example, a
Fit is first built using folds 2 and 3 and tested on
fold 1. Next, it is built data from folds 1 and 3, while predicted on fold 2. This
process continues for each fold. When this process is completed, the predictions on the
folded data sets are compared to their known values and traditional diagnostic measures
can be evaluated. Selecting a Fit based on cross-validation metrics is good practice to
ensure a balance between predictive accuracy and avoiding overfitting. The size of the
cross-validation folds can be set via the Cross-Validation option (accessed in the
Evaluate step of the Fit); the method Fit Automatically Selected by Training calculates an internal fold size to ensure efficiency.