Display a matrix as a heat map. The values of input matrix z are
mapped to the colors of the colormap.
Syntax
h = pcolor(z)
h = pcolor(x, y, z)
h = pcolor(hAxes, ...)
Inputs
x, y, z
Range of the x, y, and z axes.
Type: double | integer
Dimension: scalar | vector | matrix
hAxes
Axis handle.
Type: double
Dimension: scalar
Outputs
h
Handle of the surface graphics object.
Examples
pcolor plot with discrete colors. The 'contourtype' of the default
pcolor plot is set to 'discrete'. The color of the
(i,j) cell is defined by the z(j,i)
value.
cla;
x = 1:5;
y = 1:5;
z = [1 2 8 5 7; 5 6 3 6 7; 7 4 9 5 3; 3 2 1 1 6; 5 6 8 1 3];
ph = pcolor(x, y, z);
Figure 1. pcolor plot - discrete colors
pcolor plot with blended colors. If the 'contourtype' is set to
'blended', the color of each cell is calculated by interpolating the
colors of the cell's vertices.
cla;
x = 1:5;
y = 1:5;
z = [1 2 8 5 7; 5 6 3 6 7; 7 4 9 5 3; 3 2 1 1 6; 5 6 8 1 3];
ph = pcolor(x, y, z);
set(gca,'contourtype','blended');
Figure 2. pcolor plot - blended colors
Comments
If there are no axes, they will be created first. If x and
y are omitted, the index of the z column is used for
x coordinates, and the index of the z row is used for y coordinates.
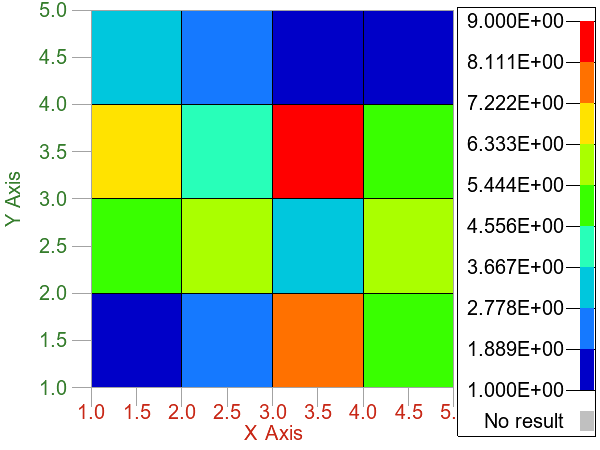 Figure 1. pcolor plot - discrete colors
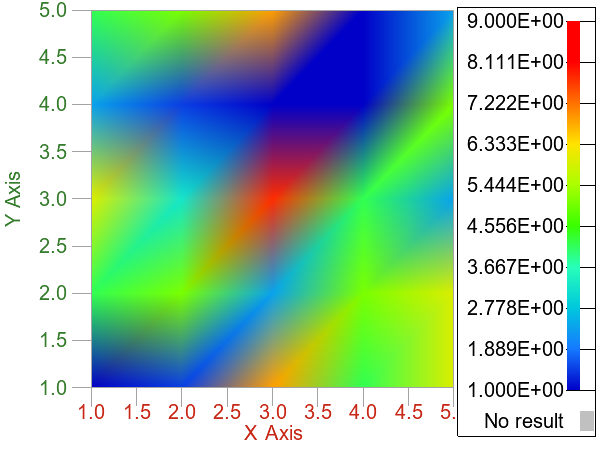 Figure 2. pcolor plot - blended colors