Annotations and Cursors
Use annotations and cursors to read and interpret plotted results.
Annotations
Add an annotation to a trace to highlight values of interest. The annotation updates along with the data and always display the value according to its definition.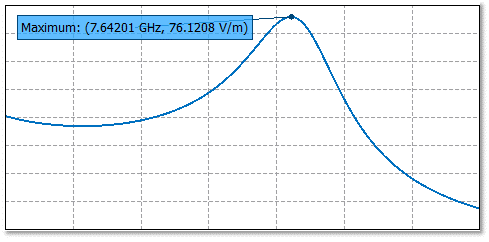
Figure 1. An example of an annotation on a Cartesian graph.
Cursors
Cursors are dynamic and allow you to interact and move the cursors. Drag the cursors until they are placed at the desired positions. Cursors allow data to be read off several traces simultaneously but suffer from the limitation that it cannot update along with the results.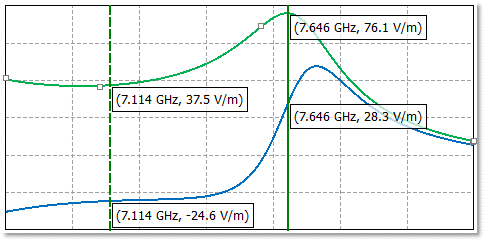
Figure 2. An example of cursors on a Cartesian graph.
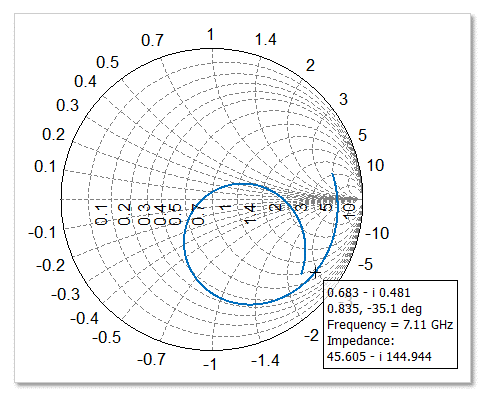
Figure 3. An example of a cursor on a Smith chart.
Note: A Smith chart has a single cursor appearing as a small
table.