Dashlet charts represent trends between two successive measure values by comparison methods.
Dashlet charts are particularly useful for viewing trends in successive measure values. They provide a quick glance of the Trend Dimension with respect to a set of Measure values.
Creating dashlet charts
1. On the toolbar, select + New Page from the Pages drop down, or on the Filters and Settings pane, select the Pages tabbed page and then click the + icon to create a new page.
2. Click
the ![]() icon in the chart area
and then select the Basic tabbed page.
icon in the chart area
and then select the Basic tabbed page.
3. Select
the Dashlet chart type or click the icon at the top right corner of
the chart area and then select Dashlet
to create a Dashlet chart.
icon at the top right corner of
the chart area and then select Dashlet
to create a Dashlet chart.
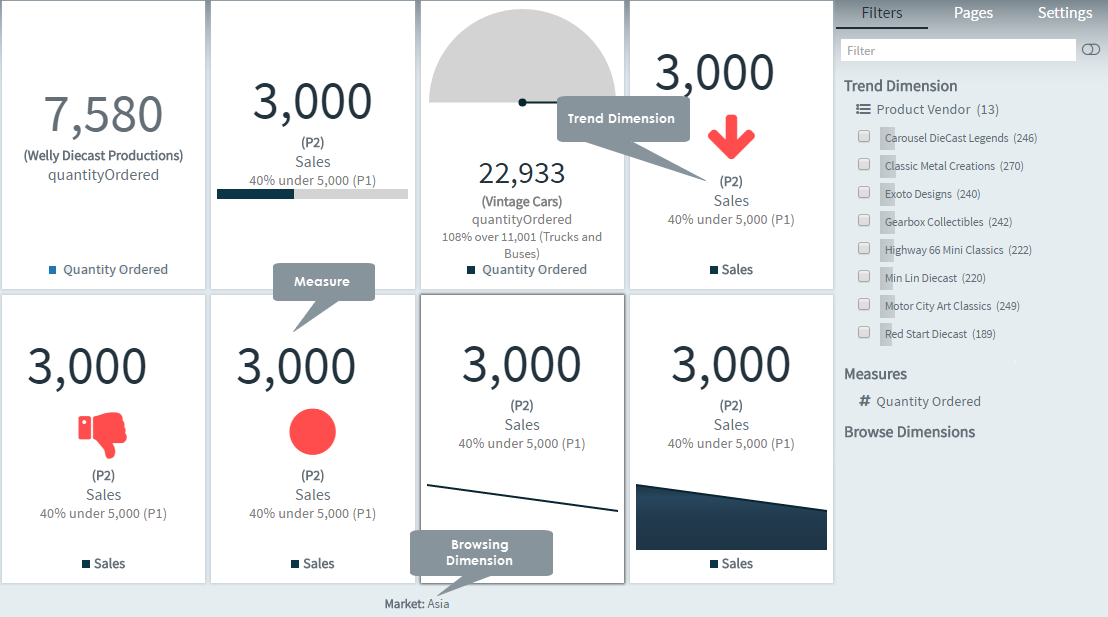
4. From the Dimensions pane, specify a Trend Dimension for the Dashlet chart (applicable only for the Arrow, Thumb, Circle, Bars, Line, and Area variants).
5. Specify a Measure for your chart.
Optionally, specify a Legend Dimension for your chart.
6. Select the Filters tabbed page to browse the chart dimensions using the Dimensions Browser, define filters and chart, page, or report properties for the Dashlet chart.
Defining dashlet chart properties
The Envision chart area comprises context-sensitive menus that allow you to click various areas of the chart to define the chart properties such as the display, label, legend, title, and so on.
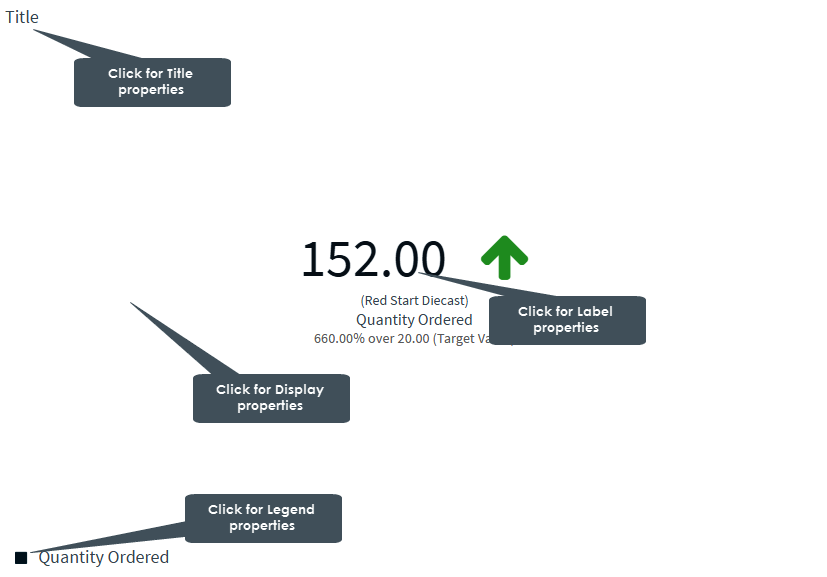
The following table explains how to define these properties.
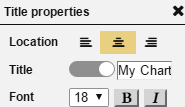
Title properties |
||
| Dialog | Property | Description |
|
Location | Select a location (left, center, right) for the title. |
| Title | Click the indicator to display or hide the chart title. Specify a new title for your chart. |
|
| Font | Select a font size and style (bold, italic) for the title. | |
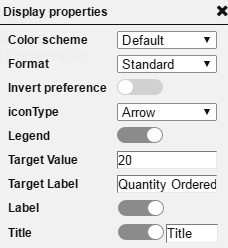
Display properties |
||
|
Color Scheme | Select a color scheme from the list of available color schemes. |
| Format | Select a format from the list of available data formats. | |
| Invert preference | Select the check box for reversing the color coding used for representation of positive and negative delta. Only applicable for the Arrow, Thumb, and Circle variants. | |
| Icon type | Select the type of Dashlet variant (progress, dial, arrow, thumb, circle, bars, line, area). For more information on variants in the Dashlet chart, see Dashlet Chart Variants. | |
| Legend | Click the indicator to display or hide the legend. | |
| Target Value | Specify a target value for displaying the Measure as a percentage of the specified target value. Applicable only for the progress and dial variants. | |
| Target Label | Specify a different label for the KPI name. | |
| Label | Click the indicator to display or hide labels for the chart values. | |
| Title | Click the indicator to display
or hide the chart title. Specify a new title for your chart. |
|
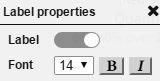
Label properties |
||
|
Label | Click the indicator to display or hide labels for the chart values. |
| Font | Select a font size and style (bold, italic) for the labels. | |
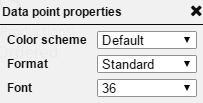
Data point properties |
||
|
Color scheme | Select a color scheme from the list of available color schemes. |
| Format | Select a font size and style (bold, italic) for the labels. | |
| Font | Select a font size for the data points. | |
Legend properties |
||
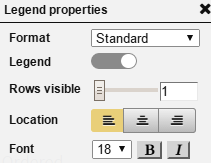 |
Format | Select a format from the list of available data formats. |
| Legend | Click the indicator to display or hide the legend. | |
| Rows visible | Drag the indicator in the range 1-10 to display the number of visible legend rows. | |
| Location | Specify a location for the legend display (left, center, right). | |
| Font | Select a font size and style (bold, italic) for the legend. | |
Envision offers eight variants of the Dashlet chart - Progress, Dial, Arrow, Thumb, Circle, Bars, Line, and Area. You must specify a Target Value only for the Dashlet - Progress and Dial variants.
In the other Dashlet chart variants such as the Arrow, Thumb, Circle, Bars, Line, and Area, in addition to specifying a Measure value, you must define a Trend dimension, and the Target Value should be set to 'NULL'. Else, the default variant - Dashlet-Number is displayed, and the chart uses the value of the last dimensional element.
When the Target Value is set to 'NULL', the last two items of the dimensional elements are used to indicate the green arrow, circle, or thumb based on the delta of the two values. You can also define the delta as 'positive is negative', in which case the color coding is reversed when the last value is lesser than the previous value. However, the default variant of the Dashlet chart is represented as Dashlet - Number, where you specify only the Measure value.
Trends in a Dashlet charts can be depicted using the Bars, Lines, or Area variants, or only a single KPI using the Circle, Arrow, or Thumb variants.
· Progress - A progress bar indicates the KPI value in the chart as a percentage of the specified target value.
· Dial - A dial indicates the KPI value in the chart as a percentage of the specified target value.
· Arrow - A green arrow indicates the trend dimension value in the chart as positive, and a red arrow pointing downwards indicates the trend dimension value as negative.
· Thumb - A green thumb sign indicates the trend dimension value in the chart as positive, and a red thumb sign pointing downwards indicates the trend dimension value as negative.
· Circle - A green circle indicates the trend dimension value in the chart as positive, and a red circle pointing indicates the trend dimension value as negative.
· Bars - Is a combination of the Dashlet - Number variant and Bar Line charts. The chart displays the KPI value as a percentage of the specified Target Value along with bars that represent the selected elements in the Trend Dimension.
· Line - Is a combination of the Dashlet - Number variant and Line charts. The chart displays the KPI value as a percentage of the specified Target Value along with lines that represent the selected elements in the Trend Dimension.
· Area - Is a combination of the Dashlet - Number variant and Area charts. The chart displays the KPI value as a percentage of the specified Target Value along with a shaded area below the lines that represent the selected elements in the Trend Dimension.
|
|
Page Properties |
Report Properties |