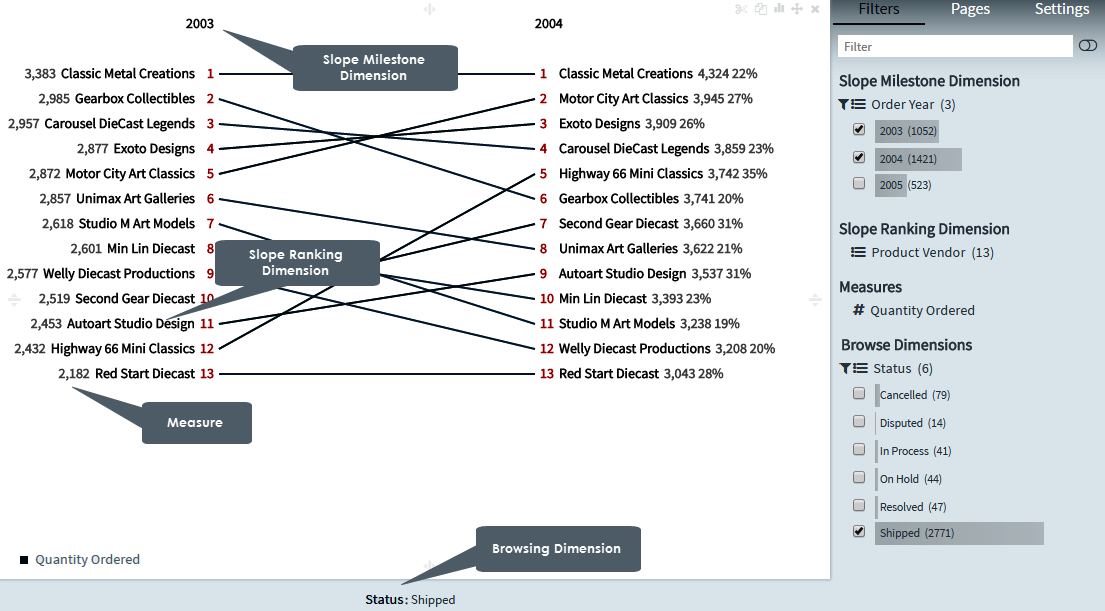
Slope Charts typically represent a 'before-and-after' story. The key value of these charts is that they provide several lines of interrogation in one single chart, revealing ranking, magnitude and transitions over time.
A Slope Chart ranks two successive dimensional elements, and then maps these ranked elements to indicate a positive or negative slope. Slope charts are particularly useful for representing the amount of transition that has taken place between two given time slots.
You see a negative or positive slope based on the values that are selected in the dimensions.
Creating slope charts
1. On the toolbar, select + New Page from the Pages drop down, or on the Filters and Settings pane, select the Pages tabbed page and then click the + icon to create a new page.
2. Click
the ![]() icon in the chart area
and then select the Advanced tabbed page.
icon in the chart area
and then select the Advanced tabbed page.
3. Select
the Slope chart type or click the icon at the top right corner of the chart area and then
select Slope to create a Slope chart.
icon at the top right corner of the chart area and then
select Slope to create a Slope chart.
4. From the Dimensions pane, specify a Slope Milestone Dimension for the Slope chart.
5. Specify a Slope Ranking Dimension for your chart.
6. Specify a Measure for your chart.
Optionally, specify a Legend Dimension for your chart.
7. In the Filters and Settings pane, select any of the following:
▪ Filters tabbed page to browse the chart dimensions using the Dimensions Browser.
▪ Pages to view all pages in the current report as thumbnails.
▪ Settings to define drill through, page, or report properties for the chart.
Defining slope chart properties
Envision allows you to define chart properties such as the color scheme, data format, fonts, labels, legend, slope delta and percent, title, and drill through.
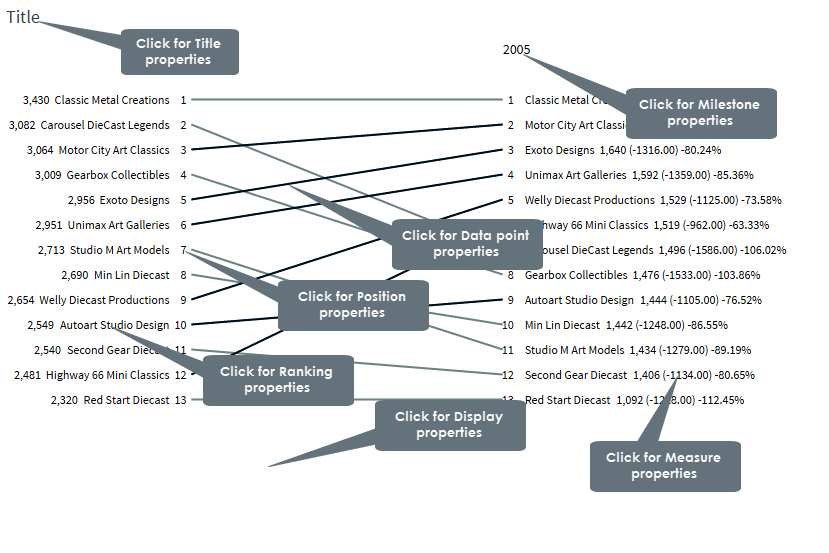
The following table explains how to define these properties.
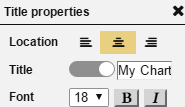
| Title properties | ||
Dialog |
Property | Description |
|
Location | Select a location (left, center, right) for the title. |
| Title | Click the indicator to display or hide the chart title. Specify a new title for your chart. |
|
| Font | Select a font size and style (bold, italic) for the title. | |
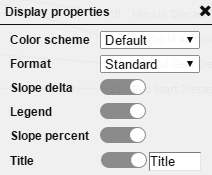
Display properties |
||
|
Color Scheme | Select a color scheme from the list of available color schemes. |
| Format | Select a data format from the list that contains the default data format as well as the data formats that you have created. | |
| Slope delta | Click the indicator to display the absolute ranking of values. | |
| Legend | Click the indicator to display or hide the legend. | |
| Slope percent | Click the indicator to display the percentage ranking of values. | |
| Title | Click the indicator to display or hide the chart title. Specify a new title for your chart. |
|
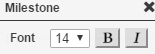
Milestone properties |
||
|
Font | Select a font size and style (bold, italic) for the Milestone
Dimension labels. |
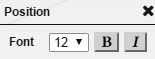
Position properties |
||
|
Font | Select a font size and style (bold, italic) for the Position labels. |
Measure properties |
||
|
Font | Select a font size and style (bold, italic) for the Measure
value labels. |
Ranking properties |
||
|
Font | Select a font size and style (bold, italic) for the Ranking Dimension labels. |
Data point properties |
||
|
Color scheme | Select a color scheme from the list of available color schemes. |
| Format | Select a data format from the list that contains the default data format as well as the data formats that you have created. | |
|
|
Page Properties |
Report Properties |