Rich Text charts allow you to insert text or HTML code within a dashboard with rich formatting options. It is similar to a Text or HTML editor with a text formatting toolbar where you can modify the font styles, format or indent text, insert pre-defined heading styles, or insert bulleted or numbered lists.
Rich Text charts are particularly useful in story telling scenarios, where you would need to insert a story slide describing a visualization in a dashboard that is relatively difficult to comprehend.
Creating rich text charts
1. On the toolbar, select + New Page from the Pages drop down, or on the Filters and Settings pane, select the Pages tabbed page and then click the + icon to create a new page.
2. Click
the ![]() icon in the chart area
and then select the Basic tabbed page.
icon in the chart area
and then select the Basic tabbed page.
3. Select
the Rich Text chart type or click the icon at the top right corner of
the chart area and then select Rich Text
to create a Rich Text chart.
icon at the top right corner of
the chart area and then select Rich Text
to create a Rich Text chart.
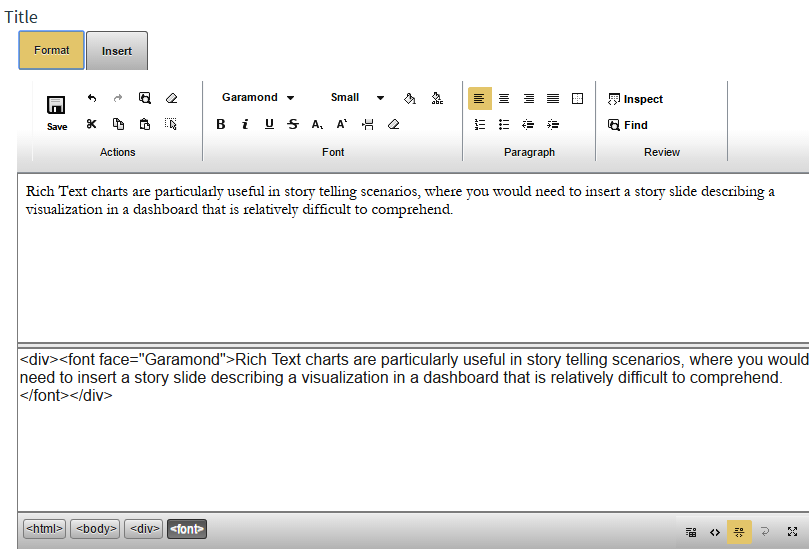
4. Insert text into the chart and then use the formatting toolbar to modify the inserted text in terms of style, indentation, and so on.
5. In the Filters and Settings pane, select any of the following:
▪ Filters tabbed page to browse the chart dimensions using the Dimensions Browser.
▪ Pages to view all pages in the current report as thumbnails.
▪ Settings to define drill through, page, or report properties for the chart.
Defining rich text chart properties
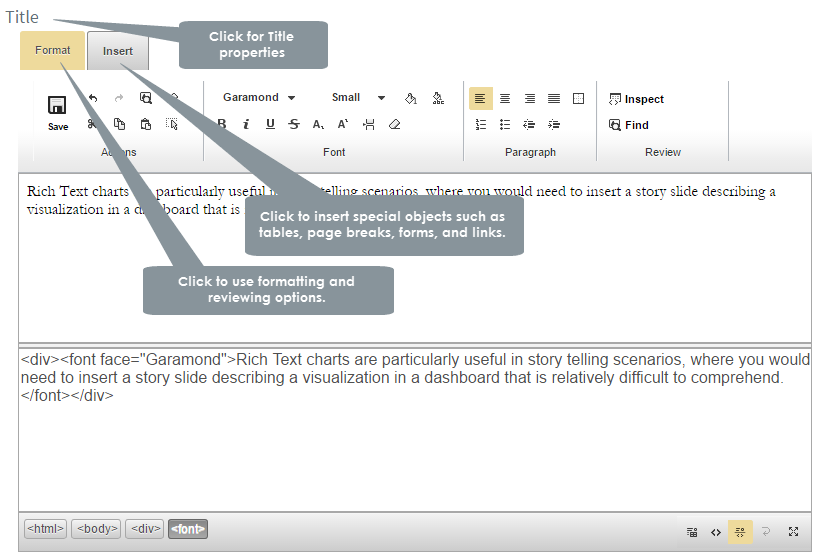
Envision allows you to define chart properties such as the title. You can use:
· The Format tabbed page to modify the text properties such as font and paragraph, and perform actions such as cut, copy, paste, preview, clean up, review the inserted text.
· The Insert tabbed page to insert tables, page breaks, and form fields such as TextArea, Lists, Radio buttons, Check boxes, and special objects such as Links, Media, Date Time, and so on.
The following table explains how to define these properties.
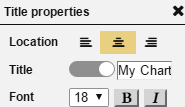
| Title properties | ||
Dialog |
Property | Description |
|
Location | Select a location (left, center, right) for the title. |
| Title | Click the indicator to display or hide the chart title. Specify a new title for your chart. |
|
| Font | Select a font size and style (bold, italic) for the title. | |
|
|
Page Properties |
Report Properties |