VectorScope
This block plots the vector input, and can be used to animate vector signals.
![]()
Library
SignalViewers
Description
This block plots the vector input, and can be used to animate vector signals.
Parameters
| Name | Label | Description | Data Type | Valid Values |
|---|---|---|---|---|
externalActivation | External activation | Specifies whether the block receives an external activation or inherits its activation through its regular input ports. When External Activation is selected, an additional activation port is added to the block. By default, external activation is not selected. | Number | 0 |
externalX | External X value | X data can be provided by the second input. Default is OFF, which uses a vector [1:n], where n is the input signal length. | Number | 0 |
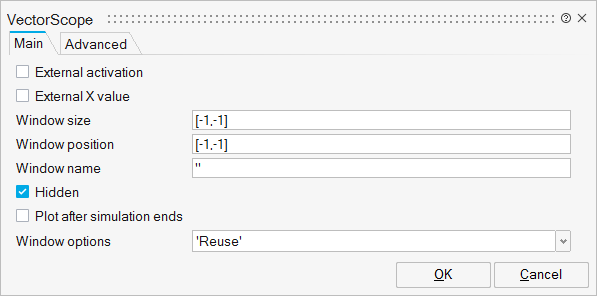
winSize | Window size | X,Y dimension of the plot window. Integer values. Default size is given as [-1,-1] and corresponds to [400,400]. | Vector of size 2 | |
winPos | Window position | X,Y position of the plot window. Integer values. Default [-1,-1] indicates the scope is positioned automatically. | Vector of size 2 | |
winNam | Window name | Name of the plot window. String. Default is empty. | String | |
winHidden | Hidden | The window is hidden initially by default. | Number | 0 |
showAtEnd | Plot after simulation ends | Display the plots (lines) at the end of simulation instead of progressively along with simulation time. | Number | 0 |
option | Window options | Define the scope window setting for a simulation. Default is 'Reuse'. | String | 'Reuse' |
| Name | Label | Description | Data Type | Valid Values |
|---|---|---|---|---|
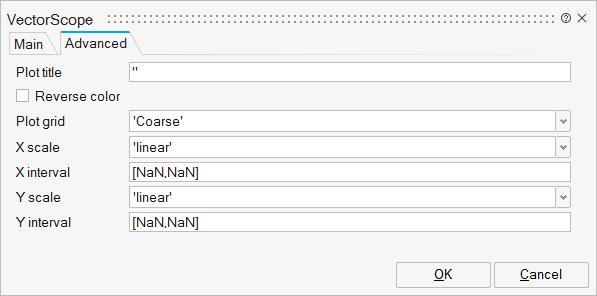
plotTitle | Plot title | String | ||
plotColor | Reverse color | Number | 0 | |
plotGrid | Plot grid | String | 'No | |
xScale | X scale | String | 'linear' | |
xInterval | X interval | Vector of size 2 | ||
yScale | Y scale | String | 'linear' | |
yInterval | Y interval | Vector of size 2 |
Ports
| Name | Type | Description | IO Type | Number |
|---|---|---|---|---|
Port 1 | explicit | input | 1+externalX | |
Port 2 | activation | input | externalActivation |
Advanced Properties
| Name | Value | Description |
|---|---|---|
always active | no | |
direct-feedthrough | yes | |
zero-crossing | no | |
mode | no | |
continuous-time state | no | |
discrete-time state | no |