


|
Rank Filtering
Rank filtering only uses the leaf item of the breakdown when creating the ranking. Consequently, this makes the number of items consistent, regardless of the hierarchy. Note that this behavior also applies to crosstabs.
Rank Filter is available in all non-time series visualizations that use the Size or Height variable:
q Bar Graph
q Bullet Graph – Horizontal & Vertical
q Categorical Line Graph
q Circle Pack
q Dot Plot
q Donut Chart
q Donut Gauge
q Funnel Chart
q Heat Map
q Map Plot
q Network Graph
q Pareto Chart
q Pie Chart
q Scatter Plot
q Treemap
q Waterfall Chart
It is also available in the Record and Table visualizations.
Steps:
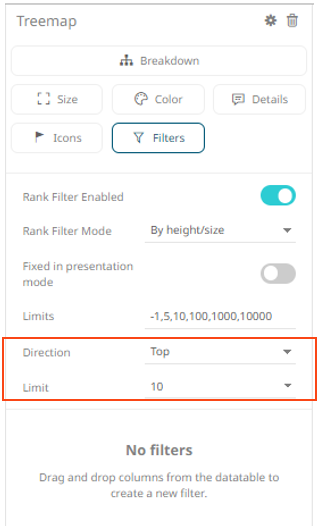
1. Click on a snapshot visualization and then click the Filters drop area on the Visualization Settings pane.
The visualization filter properties are displayed.
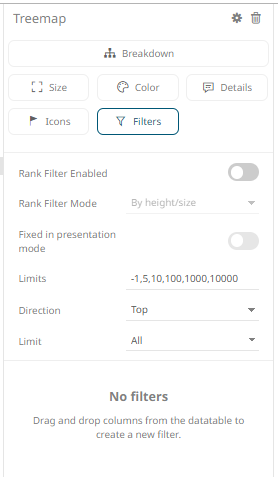
2. Tap the Rank Filter Enabled slider to turn it on.
This enables the Rank Filter Mode drop-down list.
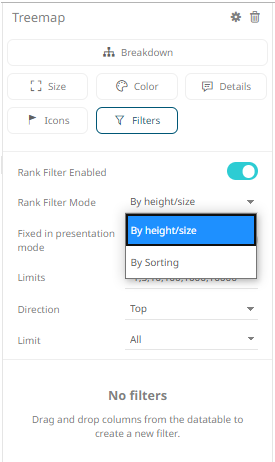
3. Select to rank filter either By Height/Size or By Sorting.
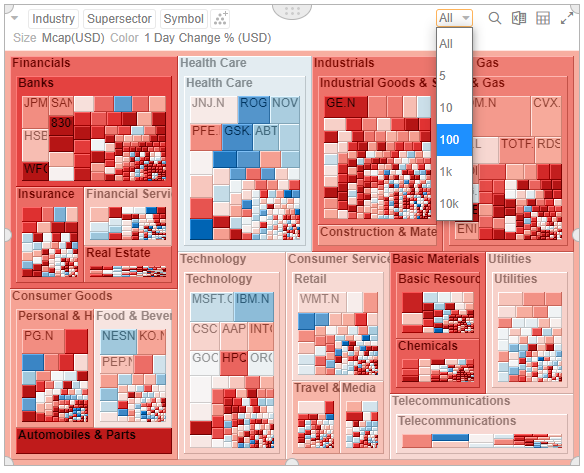
There are two drop-down lists displayed in the visualization:
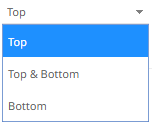
· Direction: Top, Top & Bottom, or Bottom
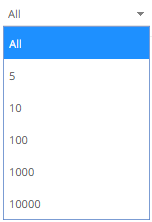
· Limit: All, 5, 10, 100, 1000, or 10000
The Limits and Direction options can be selected either:
¨ in the visualization or
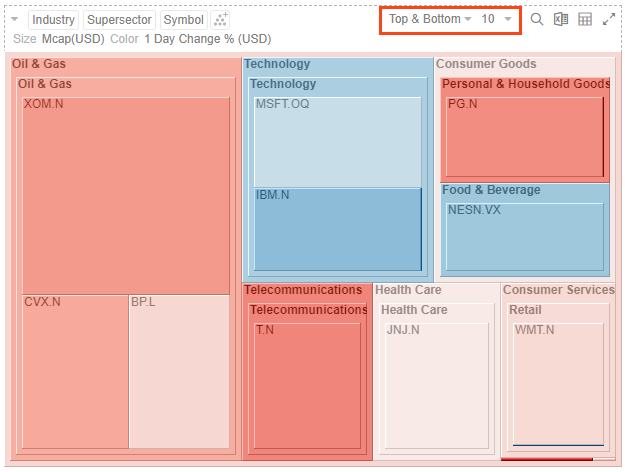
¨ on the Filter Settings pane
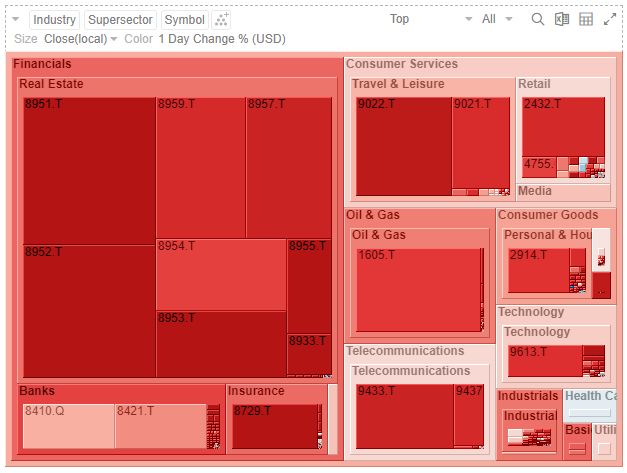
Selecting By Height/Size allows the visualization to be ranked based on column on the Size or Height variable:
Example 1: Close(local) as the Size variable
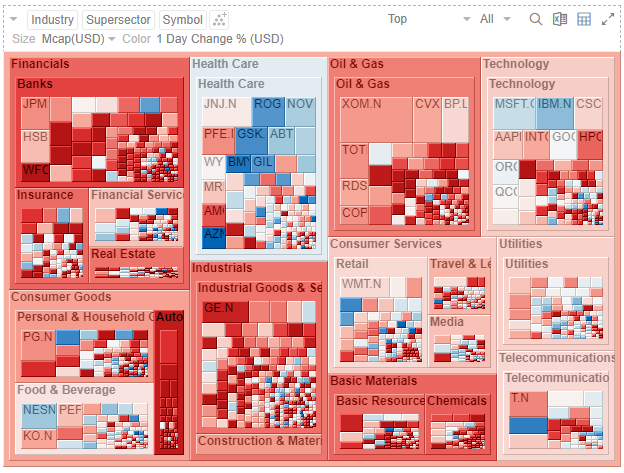
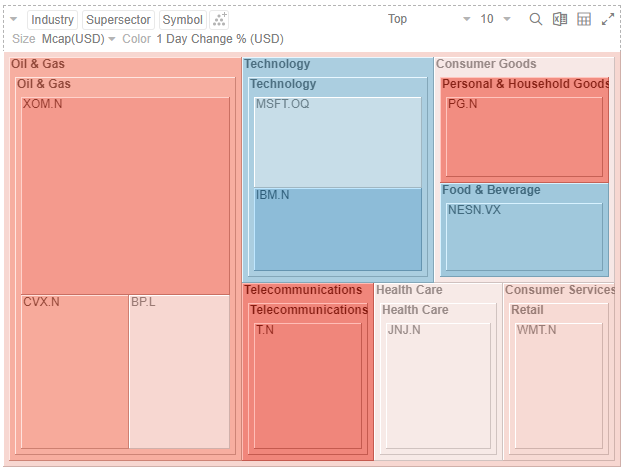
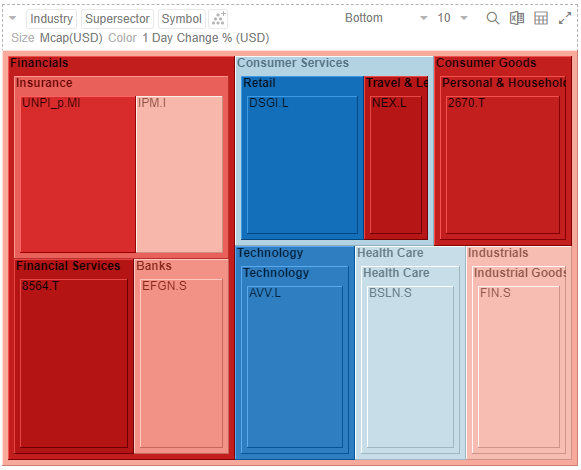
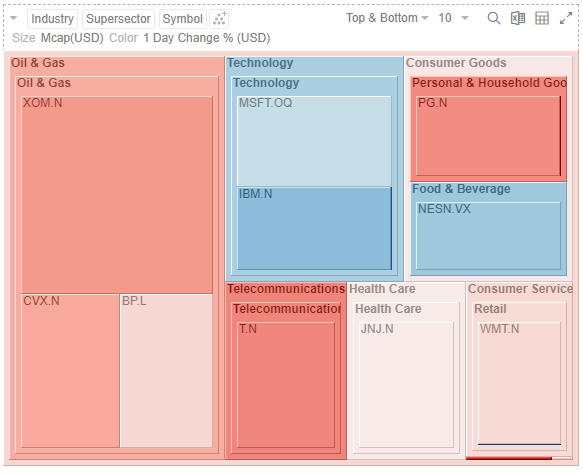
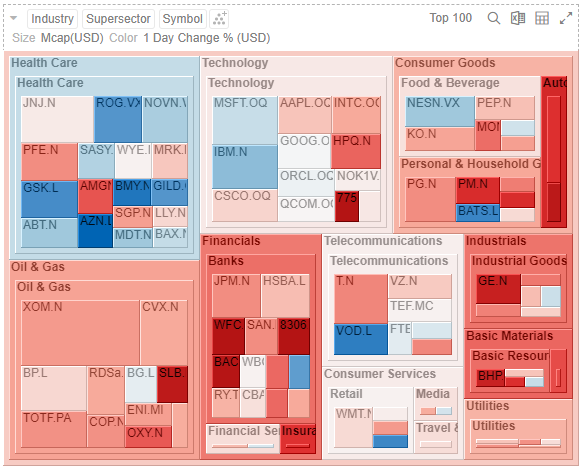
Example 2: Mcap(USD) as the Size variable
Examples:
· Top 10:
· Bottom 10:
· Top & Bottom 10:
Selecting By Sorting displays:
· All
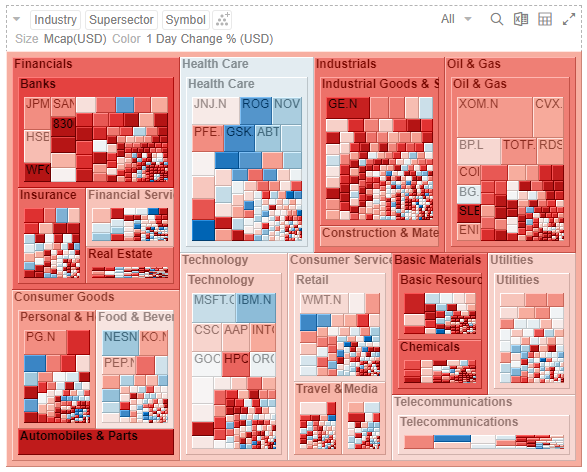
· Top 5, 10, 100, 1000, or 10000
This example displays the Top 100 values of the Size variable.
4. Tap the Fixed in Presentation Mode slider to turn it on.
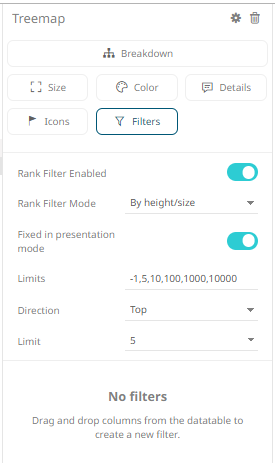
This disables the drop-down lists in the Open Workbook in Presentation Mode. Only the labels of the options are displayed:
5. Click the Save  icon.
icon.
When
saved, the  notification is displayed.