|
Rank Filtering for the Table Visualization
For the Table visualization, the rank filter only uses the leaf item of the breakdown when creating the ranking. Consequently, this makes the number of items consistent, regardless of the hierarchy.
Steps:
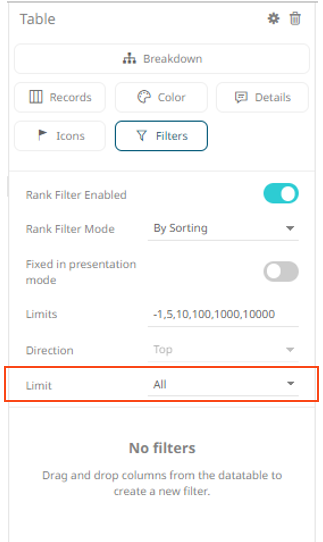
1. Click on a Table visualization and then click the Filters drop area on the Visualization Settings pane.
The visualization filter properties are displayed.
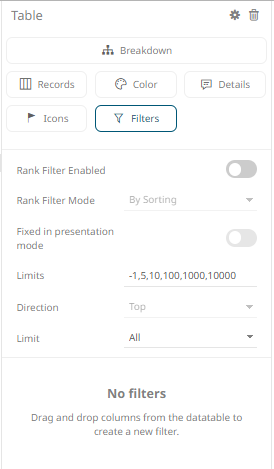
2. Tap the Rank Filter Enabled slider to turn it on.
This enables the Rank Filter Mode drop-down list and the Rank Filter Mode (set to By Sorting by default)
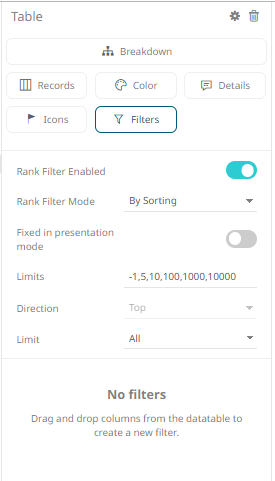
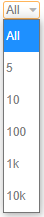
This action displays the Limit drop-down list: All, 5, 10, 100, 1k, 10k
The Limit options can be selected either:
· in the visualization or
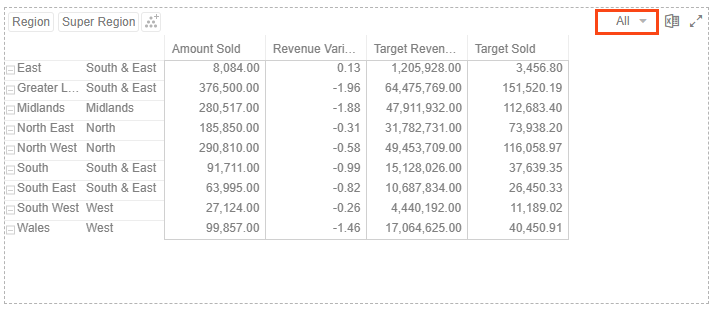
· on the Filter Settings pane
The data set will be limited to display the top/bottom n based on the sorting of the data. When a column is clicked for sorting, the data set will be limited accordingly.
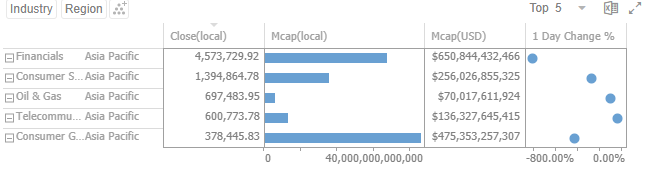
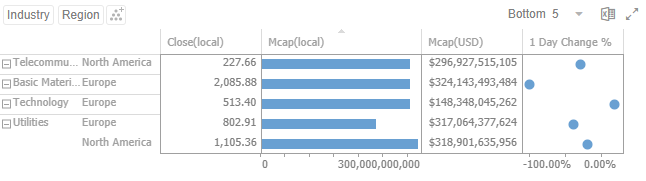
For this example, the breakdown fields are based on the sorting made (Top 5) on the first Visual Member, Close(local).
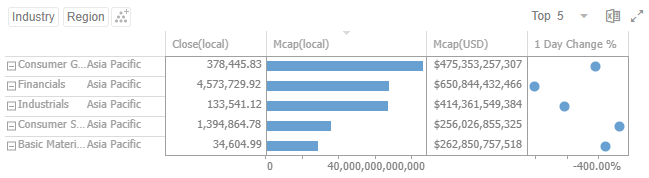
If the sorting is done on the second Visual Member, Mcap(local), then the Top 5 will be:
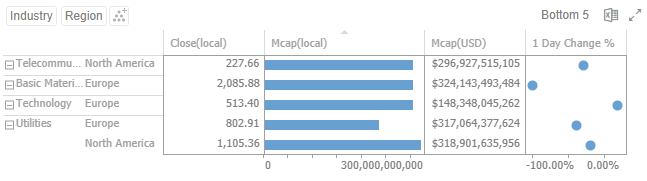
3. Clicking on the Sorting
 button of a column displays the
bottom 5 values of the leaf item (Region) for the next-leaf-mode (Industry)
in the breakdown. The Sorting drop-down list is also updated to Bottom
5.
button of a column displays the
bottom 5 values of the leaf item (Region) for the next-leaf-mode (Industry)
in the breakdown. The Sorting drop-down list is also updated to Bottom
5.
4. Tap the Fixed in presentation mode slider to turn it on.
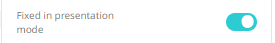
This disables the drop-down lists in the Open Workbook in Presentation Mode. Only the labels of the options are displayed: