|
»Click here to display Table of Contents«
|

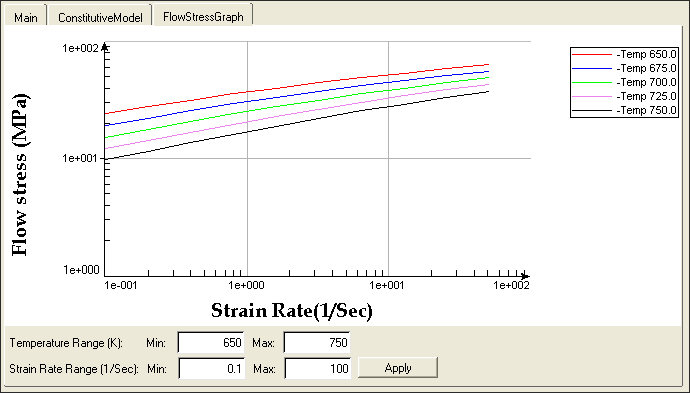
Flow Stress/Viscosity Graph |

|

|

|

|
|
Flow Stress/Viscosity Graph |
|
|
|

|