Result View
The Result View ![]() shows a hierarchical view of available results on the current load case.
shows a hierarchical view of available results on the current load case.
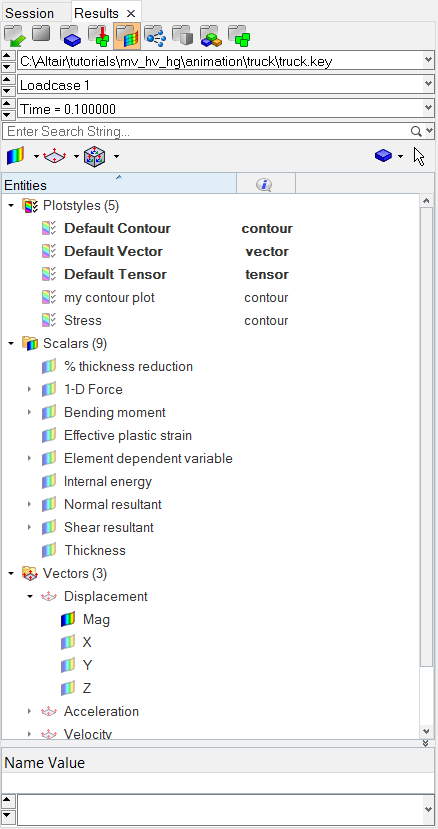
Figure 1.
Result types and components have a check box next to them indicating the type of result plot it will apply by clicking it. The result plot will be based on the current plot style substituted with the current selection for type or component. A plot style is basically a predefinition of settings applied on plot. You can change the current style by clicking the drop-down arrow next to the plot button in the Quick Plot browser toolbar.
New result types can also be created using the Expression Builder dialog. To open the Expression Builder dialog, right-click within the Results browser and select Create > Derived Result from the context menu. The Expression Builder will automatically display the type of result (if one is selected).
You can also use the drag & drop method to apply a plot. Bring up the Browser Configuration dialog by using the context menu, go to the Toolbars tab, and toggle the visibility of the toolbar by clicking the check box next to it. Once the Plot Styles folder appears in the result view you can drag & drop styles onto result types, or you can do the reverse.
The virtual collector can also be used to plot a result on a selection of components. Activate the virtual collector, select components in the graphics area (or in the tree), and then click the plot button on the Quick Plot toolbar, or click the context menu item Plot/type to bring up the result plot. If the virtual collector is set to Nodes, Elements, or Systems, the corresponding entities will be result plotted based on the graphics area selection.
Layer Selector
The Layer selector (located at the bottom of the browser) allows you to quickly go through the various layers of the current result plots (contour, tensor, or vector). This selector is available in the Result view only.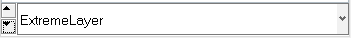
Figure 2.
Result plots will use the default Plot Style settings, however the current setting of the Layer selector will override the predefined layer from the Plot Style.