Model View
The Model View ![]() displays all of the entities within the model, as well as all tracking
systems, measures, notes, section cuts, available load cases and simulations, derived load
cases, plot styles, results, and views in a tree-like display.
displays all of the entities within the model, as well as all tracking
systems, measures, notes, section cuts, available load cases and simulations, derived load
cases, plot styles, results, and views in a tree-like display.
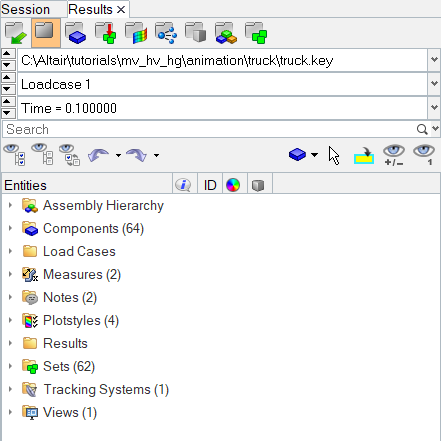
Figure 1. Model View in the Results Browser
This view also includes full display control for all applicable entities (same as in Component view).
Load Cases
A hierarchical listing of all available load cases and simulations are displayed in the Load Cases folder. The current load case and simulation are shown in bold.You can use the browser context menu to complete a variety of tasks such as; creating a new derived load case, renaming or deleting existing derived load cases, changing the scale factor on simulations, etc. See the Load Case View topic for additional information.
Materials and Properties
A hierarchical listing of all available materials and properties are displayed in their respective folders (if the Advanced Result Math template was used when importing a model input deck and result file, or in the case of a OptiStruct solver, only H3D as model and result provided OptiStruct has written out this information to the H3D). Currently OptiStruct outputs the following material and property types to H3D: MAT1, MAT2, MAT8, MAT9, PSHELL and PSOLID. Additional types will be added in the future. Unused materials and properties are not written to the .h3d file. The material and property labels will appear as<Mat/Prop type>_ID.You can use the browser context menu to complete a variety of tasks such as; showing or hiding materials and properties, isolating materials and properties, or isolating only materials and properties.
Plot Styles
A plot style is a collection of predefined settings for a contour, vector, or tensor result plot type. The default plot styles provided by HyperView are displayed in the Plot Styles folder: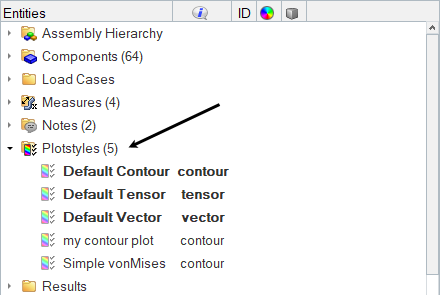
Figure 2.
One plot style of each type can be set as current. If you click a button on the Quick Plot toolbar, or enable a result plot through the browser context menu, the predefined settings of your current plot style will be used.
To create a contour plot style: go to the Contour panel, define all necessary settings, and click Apply to plot the desired result. Once the result plot is visible in the graphics area, you can create a plot style by: clicking on the Create Plot Style button (located on the right side of the panel) or bringing up the context menu from the modeling window or browser, clicking Create > Plot Style, and then select the type of plot.
Plot styles can be renamed by using the Rename option in the browser context menu.
You can also quickly overwrite one of your predefined settings in the plot style by selecting a result item in the browser and then plotting the result. For example if your current contour plot style is set to Stress XX however you want to plot Strain XX, simply select Strain in the Result view and then click Plot > Contour. All of the predefined settings will be used; however the current selection will overwrite the plot style setting. A contour plot of Strain XX is displayed in the graphics area. If you would like to plot another result component "YY" for instance, select YY in the browser and then apply the contour plot. The Stress/YY plot will be displayed in the graphics area.
The predefined plot styles come initially from a file in your HyperWorks installation directory. To import or export your own plot styles and make them your default: go to the Tools menu and select Import > Plot Styles or Export > Plot Styles, or select the Result view for the Results browser, right-click and select Import Styles or Export Styles option from the context menu.
Results
Result types and components have a checkbox next to them indicating the type of result plot it will apply by clicking it. The result plot will be based on the current plot style substituted with the current selection for type or component. A plot style is basically a predefinition of settings applied on plot. You can change the current style by clicking the drop-down arrow next to the plot button in the Quick Plot browser toolbar.Views
You can save and retrieve an unlimited number of views. To save a view, bring up the context menu from the browser (or modeling window) and select Create > View. The newly created view will automatically be displayed in the Views folder: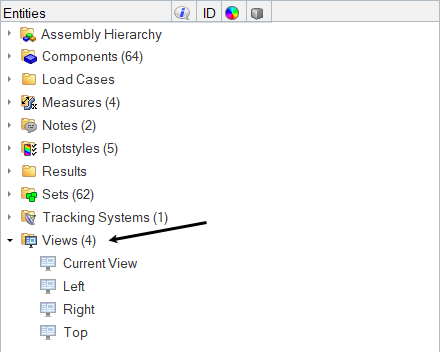
Figure 3.
After a view is created you can give it a meaningful name by renaming it. Select the view in the browser, right-click to bring up the context menu, and click Rename.
To retrieve a particular view, simply click on the icon next to the desired view.
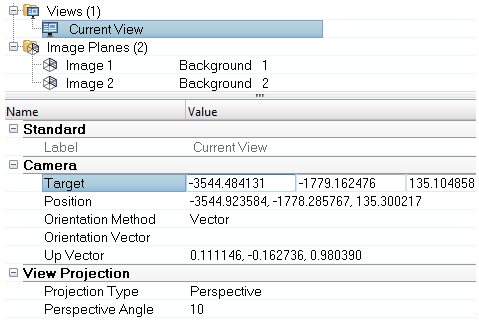
Figure 4.
See the Views section of the Entity Editor topic for additional information regarding adjusting and modifying the various view modes (Orthographic, Perspective, or Lens).
Other Items
Other items such as measures, tracking systems, section cuts, notes, sets, systems, and streamlines will also be displayed in the Results Browser. Each folder will contain all of the available items for each respective item (Measures, Notes, etc.). You can expand the folder to see all of the details for each item.The various tools and controls in the Results Browser, including the browser context menu, allow you to complete a variety of tasks such as; turn on/off the display of items, create new items, rename or delete existing items, etc.
Entity Editor
The Entity Editor section of the Results Browser allows you to view and edit various entity conditions/properties. Click on an entity in the upper portion of the browser to automatically display the properties assigned to that entity in the Entity Editor (located in the lower half of the browser).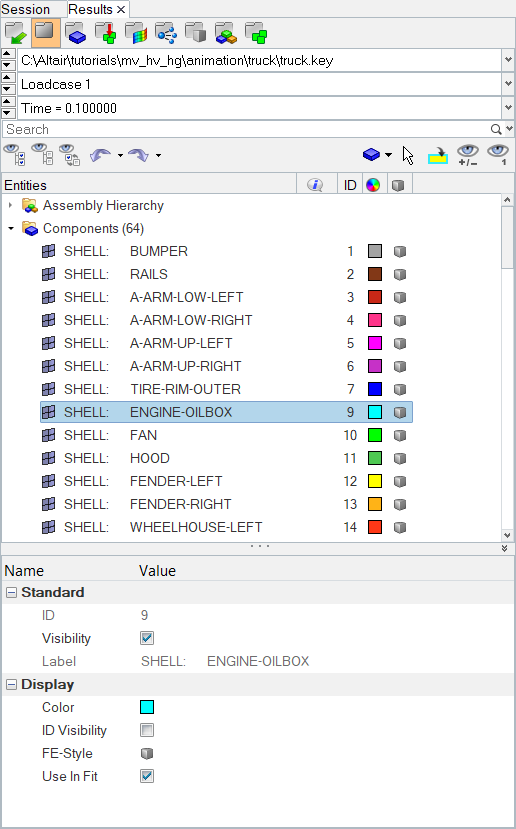
Figure 5.