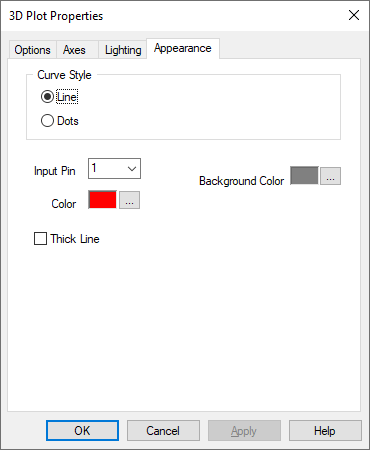
If you select a curve plot, you use the Appearance property sheet to control the curve style and line thickness, input pin color, and background color of the plot.
Background Color: Specifies the background color of the plotting window. To choose a new color, click … and make the appropriate selections in the Color dialog box. Click OK when you are satisfied with your selection. The color you chose is previewed next to Background Color.
Color: Applies a color to the specified input pin and corresponding curve. To choose a new color, click … and make the appropriate selections in the Color dialog box. Click OK when you are satisfied with your selection. The color you chose is previewed next to Color.
Dots: Plots the individual data points, as shown in the Lorenz Attractor plot below:

Line: Plots a 3D curve or line, as shown in the Lorenz Attractor
plot below:
Input Pin: Lets you specify up to eight input pins. Each pin represents an individual curve. To add or remove or remove pins, use the Add Connector and Remove Connector commands.
Thick Line: Turns on antialiasing mode, which results in thicker, smoother, and uninterrupted lines.