Scope
This block plots data with respect to simulation time.
![]()
Library
SignalViewers
Description
The Scope block displays its input with respect to simulation time. The Scope block allows for multiple inputs.
For defining plot signals,the Scope block provides a number of parameters including axis, range, labels and graphical properties.
Parameters
| Name | Label | Description | Data Type | Valid Values |
|---|---|---|---|---|
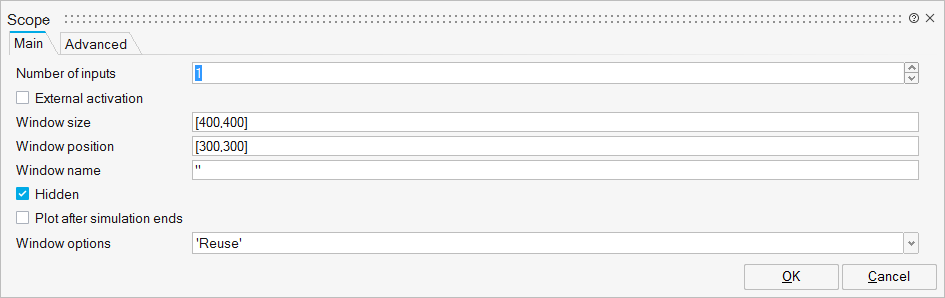
nin | Number of inputs | Number of input signals. Integer value. Default 0. | Number | |
externalActivation | External activation | Specifies whether the block receives an external activation or inherits its activation through its regular input ports. When External Activation is selected, an additional activation port is added to the block. By default, external activation is not selected. | Number | 0 |
winSize | Window size | X,Y dimension of the plot window. Integer values. Default size is given as [-1,-1] and corresponds to [400,400]. | Vector of size 2 | |
winPos | Window position | X,Y position of the plot window. Integer values. Default [-1,-1] indicates the scope is positioned automatically. | Vector of size 2 | |
winNam | Window name | Name of the plot window. String. Default is empty. | String | |
winHidden | Hidden | The window is hidden initially by default. | Number | 0 |
showAtEnd | Plot after simulation ends | Display the plots (lines) at the end of simulation instead of progressively along with simulation time. | Number | 0 |
option | Window options | Define the scope window setting for a simulation. Default is 'Reuse'. | String | 'Reuse' |
| Name | Label | Description | Data Type | Valid Values |
|---|---|---|---|---|
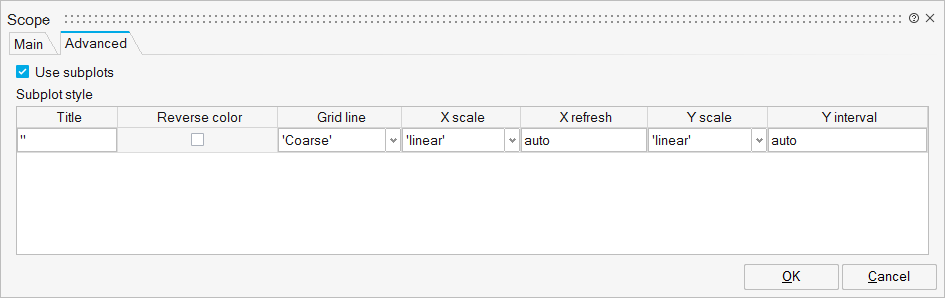
useSubplot | Use subplots | Number | 0 | |
win_s | Subplot style | Structure | ||
win_s/title | Title | Cell of strings | ||
win_s/reverseColor | Reverse color | Cell of numbers | 0 | |
win_s/grid | Grid line | Cell of strings | 'No | |
win_s/xScale | X scale | Cell of strings | 'linear' | |
win_s/xRefresh | X refresh | Cell of scalars | ||
win_s/yScale | Y scale | Cell of strings | 'linear' | |
win_s/yInterval | Y interval | Cell of vectors of size 2 | ||
plotTitle | Plot title | String | ||
plotColor | Reverse color | Number | 0 | |
plotGrid | Plot grid | String | 'No | |
xScale | X scale | String | 'linear' | |
xRefresh | X refresh | Scalar | ||
yScale | Y scale | String | 'linear' | |
yInterval | Y interval | Vector of size 2 | ||
signals | Signals | Structure | ||
signals/name | Name | Cell of strings | ||
signals/color | Color | Cell of scalars | ||
signals/marker | Marker | Cell of scalars |
Ports
| Name | Type | Description | IO Type | Number |
|---|---|---|---|---|
Port 1 | explicit | input | nin | |
Port 2 | activation | input | externalActivation |
Advanced Properties
| Name | Value | Description |
|---|---|---|
always active | no | |
direct-feedthrough | yes | |
zero-crossing | no | |
mode | no | |
continuous-time state | no | |
discrete-time state | no |