


|
R Transform
An R script can be executed as a data transformation step in the data pipeline. Specifically:
-
Data is retrieved from an underlying source.
-
The returned data table is translated into an R data frame.
-
The R data frame, and supplied R Script are passed to an external R process running Rserve.
-
The external Rserve process returns a resulting R data frame.
-
The returned data frame is translated into a Panopticon Designer (Desktop) table for visualization rendering.
For this to occur, both R and Rserve must be installed, and initialized.
NOTES:
-
When used with streaming data sources (e.g., message bus), the Real Time Limit of a streaming data source should be set to a value longer than the time taken to perform the R data transform.
For example, if the transform operation takes 2 seconds, the Real Time Limit should be set to 2500 milliseconds.
-
When used for non-streaming data sources (e.g., Database), the Data Table Refresh period should be set to a value longer than the time taken to perform the R data transform.
For example, if the transform operation takes 2 seconds, the Data Table Refresh period should be set to 3 seconds.
When the R Transform is selected the dialog changes to show:
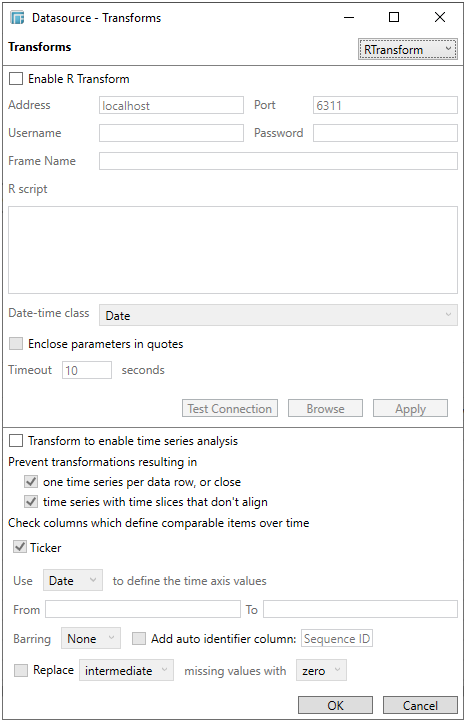
Performing R Transform
-
Select Enable R Transform.
The default Address (i.e., localhost) and Port (i.e., 6311) fields are displayed.
-
Specify the Username and Password if authentication is enabled on the Rserve process.
-
The Frame Name that Panopticon Designer will produce, and then be utilized by the R scripts should be specified.
-
The R Script should be entered or loaded from an associated file (selected by clicking the Browse button). This R script should reference the input frame name, and return a data frame. Just like an underlying SQL query, the R Script itself can be parameterized.
NOTE: This step will work for small and simple use cases. However, when you have several transforms, or when each transform is applied to several data tables, it is highly recommended to follow the instructions in the Best Practices on Working with R Transform in Panopticon section.
-
Click Test Connection. A confirmation dialog displays to show that the connection was successfully established.
-
Select the Date Class that will be applied to the transform:
-
-
Date is the simplest data type to use for calendar dates. It is stored as integers and is represented as the number of days since 1970-01-01, with negative values for earlier dates.
-
Chron that can be used for chronological objects which can handle dates and times.
-
POSIXct is built-in POSIXt Date/Time data type with ct that stands for calendar time. It stores the number of seconds since the origin.
-
-
Specify whether to Enclose Parameter in Quotes.
-
The Timeout is set to 10 seconds by default to ensure that slow running R scripts do not impact other areas of the product. You can opt to enter a new value.
-
Click Apply. This prepares the time series analysis.
-
Refer to Enable Time Series Analysis for more information in enabling this feature.
Enabling the time series analysis when you perform a R Transform solves the problem of having to specify all of the values. It also allows you to choose which Time column should be used to specify the time series.
-
Click OK.