


|
Kx kdb+tick
The Kx kdb+tick connector allows connection to a Kx kdb+ ticker plant on a real-time streaming basis. It is provided as an example, and can easily be demonstrated using the basic example ticker plant, which is detailed at:
http://code.Kx.com/wiki/Startingkdbplus/rdb
Specifically the connector allows Panopticon Designer (Desktop) to subscribe to Kx kdb+tick, through the definition of:
-
Service
-
Table
-
Symbol
Or directly through:
-
Functional Subscription
Using Kx kdb+tick
-
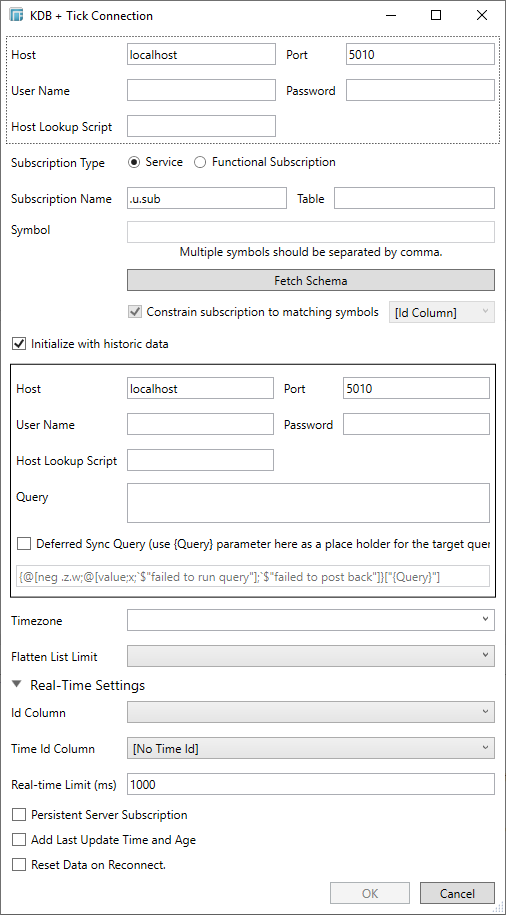
When creating a new data table, select KDB + Tick from the Connect to data dialog. The KDB + Tick Connection dialog displays.
-
Enter or set the following:
| Property |
Description |
|
Host |
Kx kdb+Tick host address. |
| Port |
Kx kdb+Tick host port. Default is 5010. |
| User Name |
The user Id that will be used to connect to Kx kdb+Tick. |
| Password |
The password that will be used to connect to Kx kdb+Tick. |
| Host Lookup Script
|
Key of the authentication script setting that will be retrieved from the Altair Panopticon Connector Settings. The authentication script setting will issue a shell script call passing a JSON structure containing host, port, username, and password (as below). { "host": "host", "port": 5001, "username": "username", "password": "password"}
NOTES:
Calling the script in-process from the Tomcat server running Panopticon allows automatic pick-up of the Kerberos token of the system account that started the Tomcat process.
NOTE: An exception will be thrown if the key used in the connector is not configured in the Altair Panopticon Connector Settings. |
NOTE: Host, Port, User Name, Password, and Host Lookup Script can be parameterized.
-
Enter or set the following:
-
-
Service
-
Enter the following properties:
-
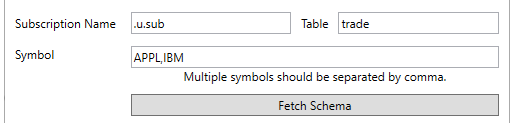
Subscription service (Default: .u.sub)
NOTE: Instead of entering the table and symbol to subscribe against in the Table and Symbol text boxes, you can specify the full subscription syntax in the Subscription Name text box. For example:
.u.sub[`table;`symbol]
To subscribe to the trade table and AAPL, AIG, and DOW symbols, enter this in the Subscription Name text box:
.u.sub[`trade;`AAPL`AIG`DOW]
-
Table to subscribe against (e.g., trade)
NOTES:
-
You may use just a back tick for the table name, intending to subscribe to all available tables.
-
When a table name is not entered in the Table text box, then the Symbol text box is disabled meaning it will not be used while doing subscription.
-
Symbol to subscribe against (e.g., AAPL)
NOTE: Multiple symbols should be separated by a comma.
-
-
Functional Subscription
-
Enter the functional subscription that needs to be issued (e.g., u.sub[`trade;`]
-
Click Fetch Schema to retrieve the schema of the configured subscription.
This populates the Id Column with the set of columns from the schema of type sym and the text array such as Character/Boolean/GUID, etc.
-
Check Constrain subscription to matching symbols to select the column which contains specific symbols. Otherwise, the filtering against these symbols will not take place.
NOTE: The Constrain subscription to matching symbols only lists sym fields. Therefore, if you select a non sym type in the Id Column, it is not recommended to select the default value [Id Column] in the Constrain subscription to matching symbols drop-down list.
-
Activate or deactivate Initialize with historic data. If unchecked, the data source will only be populated with streaming updates that are subscribed against. If checked, the data source is first initialized against a store of data, after which subscribed streaming updates are then applied.
As a result, when this option is unchecked, viewing the visualization on the Panopticon Visualization Server, the initial graph will be empty, as it is being built up as data arrives. If checked, the initial graph can be populated with historical data, and then start scrolling as new data updates occur.
-
Enter the following information:
-
-
Host
-
Port
-
User Name
-
Host Lookup Script
-
Password
-
Query
-
All of these values can be parameterized.
-
Select the Time zone.
-
Select the Flatten List Limit.
This allows retrieval of the first ‘n’ items in the list and produce new columns in the output schema with a dot notation.
For example, if there are two nested fields (BidPrices and OfferPrices) and the flatten list limit selected is five, then the output schema will be:
BidPrices.1, BidPrices.2, BidPrices.3, BidPrices.4, BidPrices.5, OfferPrices.1, OfferPrices.2, OfferPrices.3, OfferPrices.4, OfferPrices.5
If there are less than five items in the list, then the values will be null.
NOTE: Currently, this feature works for the Service subscription type. Also, it only flattens numeric columns.
-
Expand Real-Time Settings.
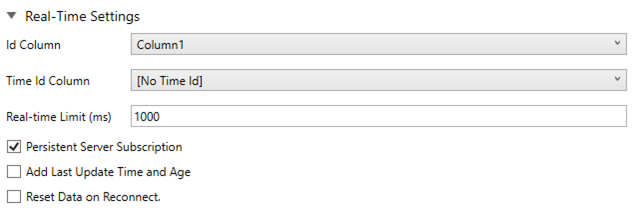
Refer to Defining Real-Time Settings for more information.
-
Click OK to confirm the selection and retrieve the record set into Panopticon Designer (Desktop).
Initially, there is no data displayed in the Data Source Preview section of the Edit Data Table window.
Click the Start Preview button to display the data and refresh the values depending on the defined Refresh Period.