|
Joining Multiple Data Tables
There are occasions where the desired data is not achieved or available using a single query and table. This is often the case with time series where you want to join a static data set to a time series database.
To join multiple tables in Panopticon Designer (Desktop), add the source tables to the Edit Data Table screen and join them using a common field or a join key. Furthermore, you can also perform a transform of a table for time series analysis, if required.
In this section, we will discuss how to join the following sample tables using two common fields.
NOTES:
-
Joining two data sources can be done using more than one left and right key columns is now supported.
-
It is no longer needed to modify the data types to text to join data sources.
Sample Table 1
|
Item |
isodatetime |
ask_price |
ask_volume |
bid_price |
bid_volume |
|
Price |
2008/01/17 13:00:00 |
17.75 |
2 |
17.65 |
1 |
|
Rate |
2008/01/17 13:00:01 |
17.70 |
2 |
17.64 |
1 |
|
Price |
2008/01/17 13:00:00 |
17.74 |
1 |
17.61 |
1 |
Sample Table 2
|
TradeID |
RatePrice |
ISODateTime |
trade_price |
trade_volume |
Side |
AggressivePassiveDark |
|
1 |
Price |
2008/01/17 13:00:00 |
17.79 |
200 |
Buy |
Aggressive |
|
2 |
Rate |
2008/01/17 13:00:02 |
17.65 |
100 |
Sell |
Dark |
|
3 |
Price |
2008/01/17 13:00:04 |
17.72 |
100 |
Buy |
Dark |
|
4 |
Price |
2008/01/17 13:00:06 |
17.706 |
200 |
Sell |
Passive |
Joining Data Tables
-
In the Edit Data Table, add the first data source.
-
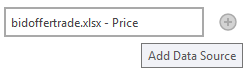
To add another data source, click
 .
.
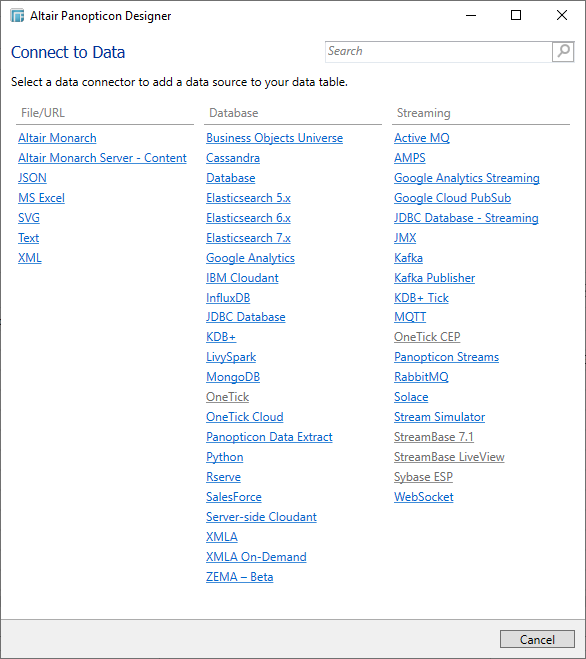
The Connect to Data dialog displays.
-
Select a data connector to browse the new data source.
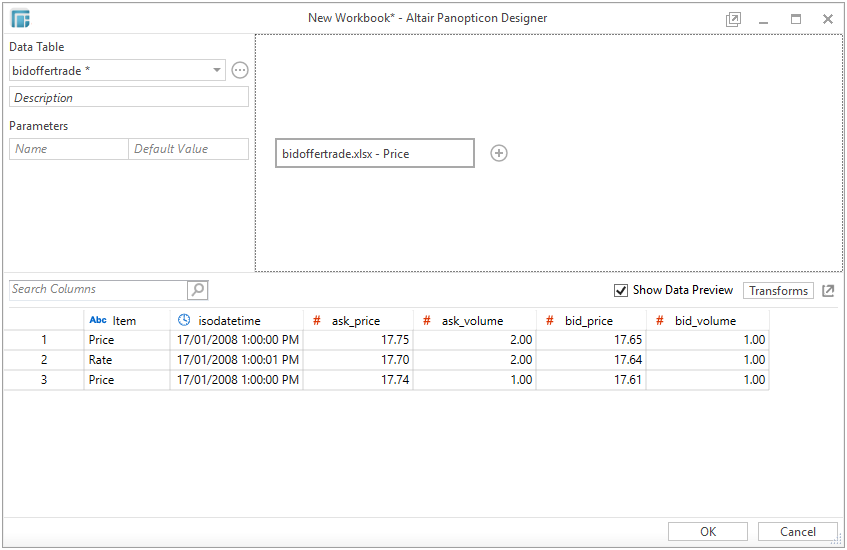
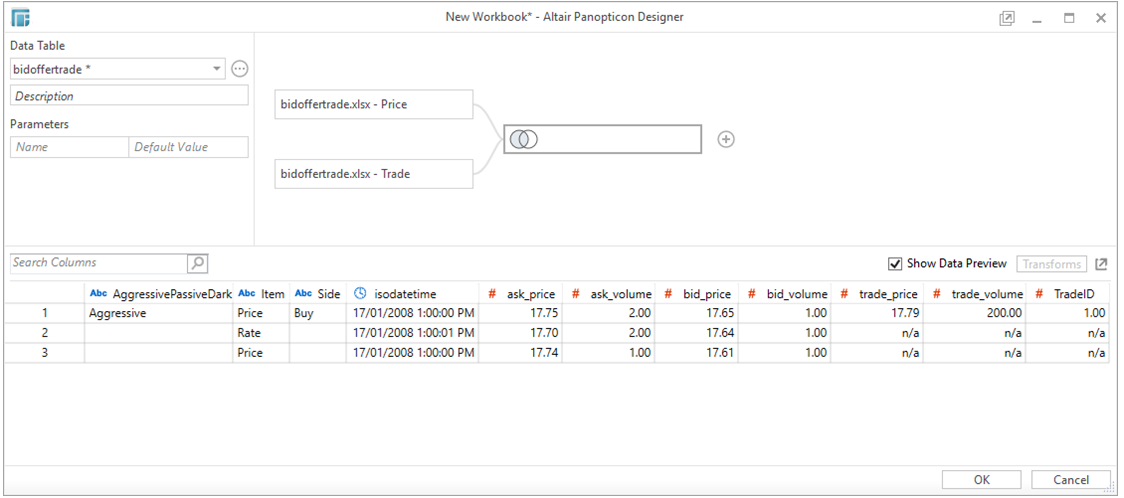
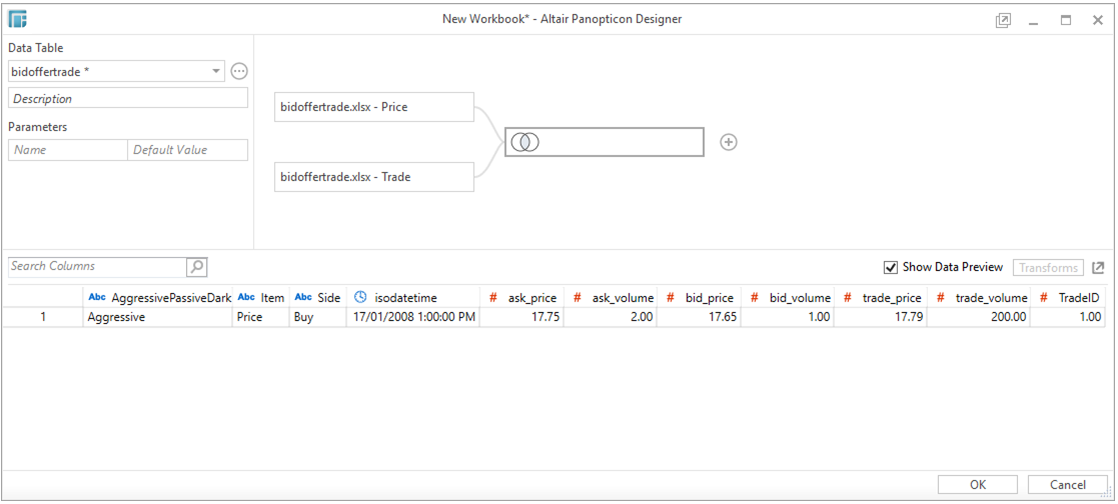
Here is a sample with the bidoffertrade.xlsx – Price and bidoffertrade.xlsx – Trade data sources:
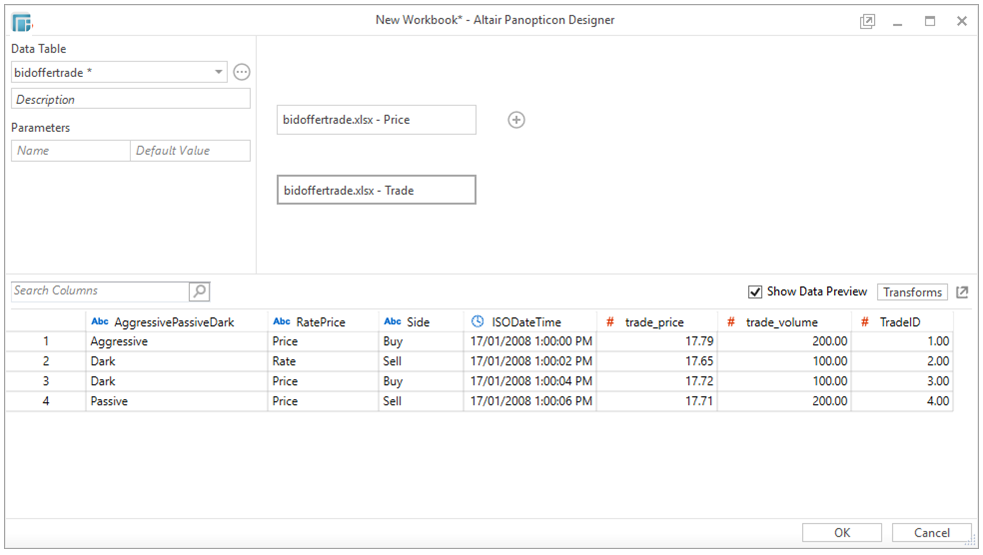
The Data Preview area displays the data of the highlighted or selected data source bidoffertrade.xlsx – Trade.
To display the other data source (bidoffertrade.xlsx – Price) in the Data Preview, hover on its box, the is displayed:
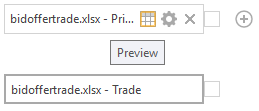
Click to display the details of the data source in the Data Preview.
-
Drag a box of a data source to the other one.
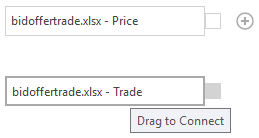
This creates a visible line connecting both tables and the Join Configuration dialog displays with the suggested join keys.
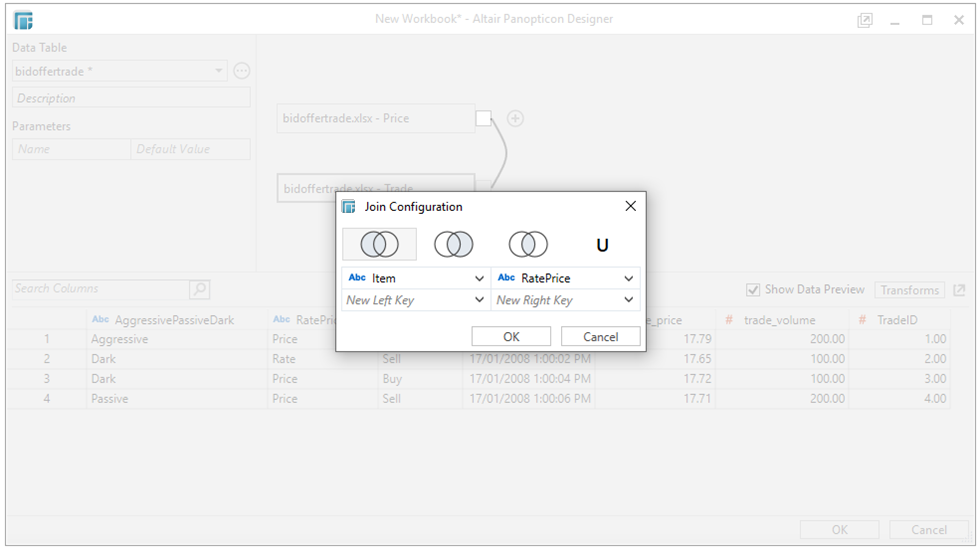
-
Select a join Type and click OK. The selected join type is displayed in the Join Definition box and the table of the joined data sources is loaded in the Data Preview area.
-
-
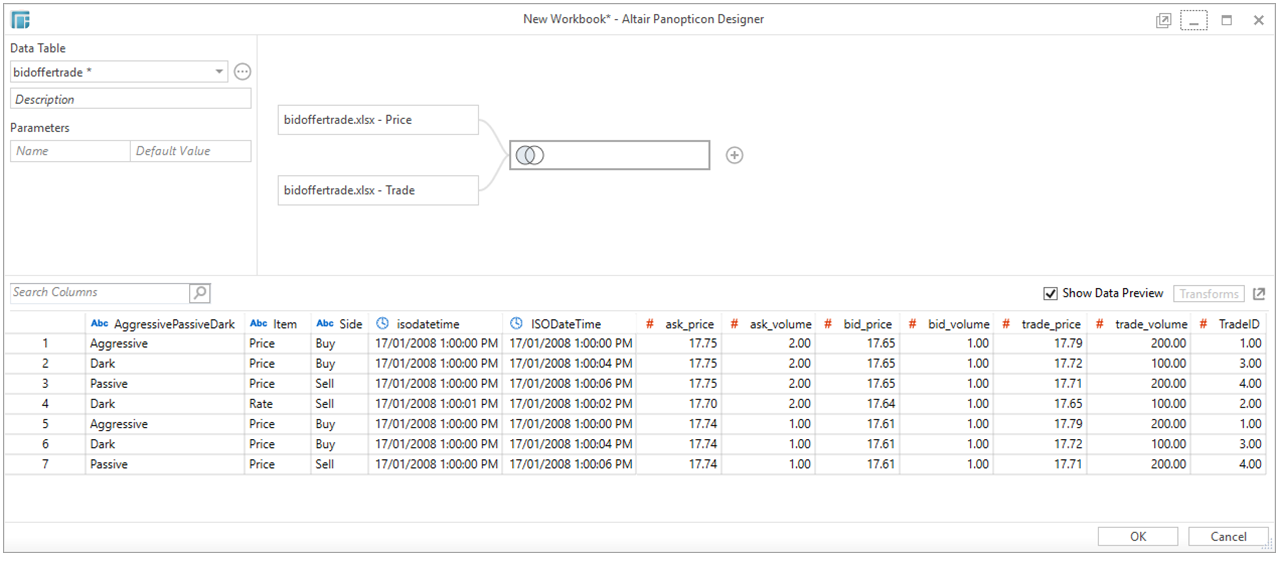
Left Outer Join

-
Keep all rows from the left table. When there are no matching values from the right table, empty values will be returned.
The joined table now displays seven rows based on the Item join key of the left table.
-
-
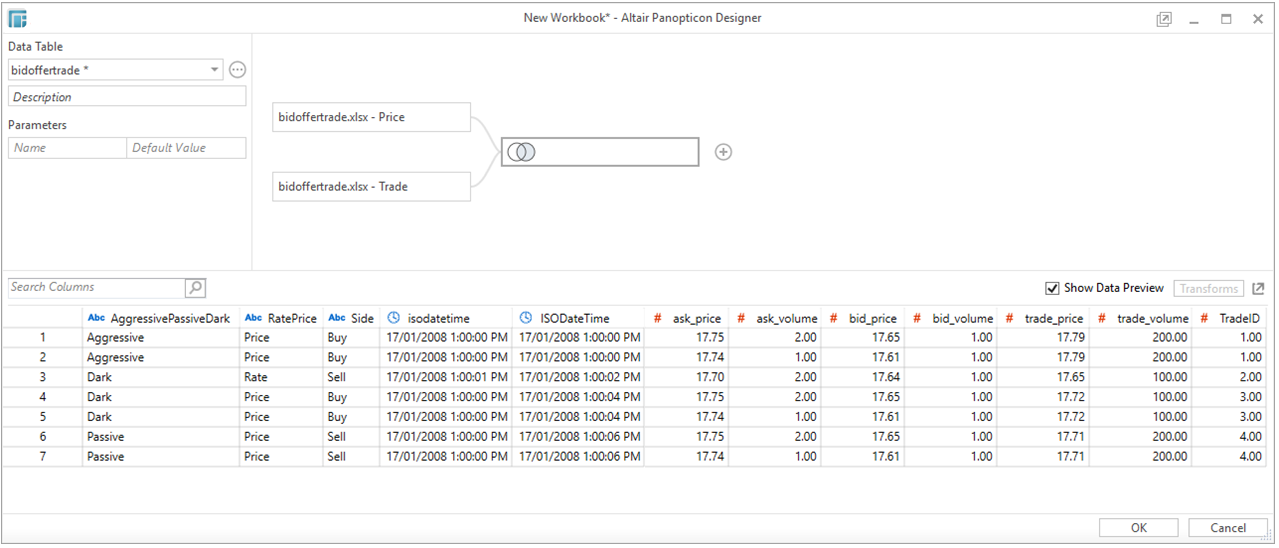
Right Outer Join

-
Keep all rows from the right table. When there are no matching values from the left table, empty values will be returned.
The joined table now displays seven rows based on the RatePrice join key of the right table.
-
-
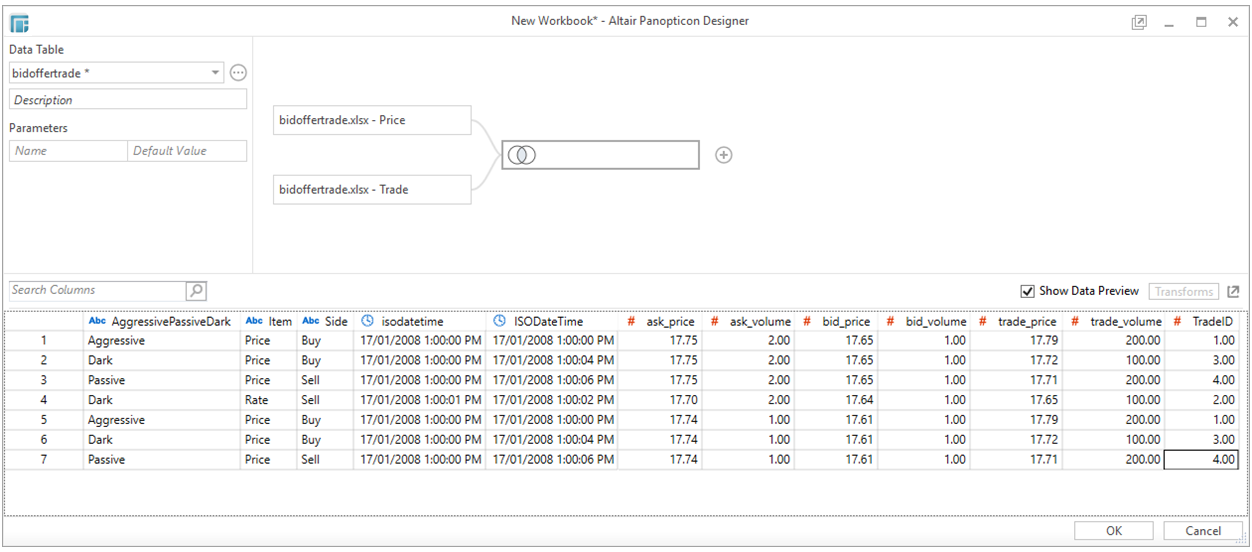
Inner Join

-
Select only rows from both tables for which the join keys match.
The joined table now displays seven rows based on the Item/RatePrice join keys of both tables.
-
Now, let us add new left and right join keys. Click the Jojn Settings
 icon.
icon.
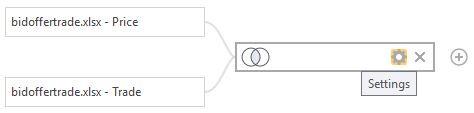
The Join Configuration dialog displays.
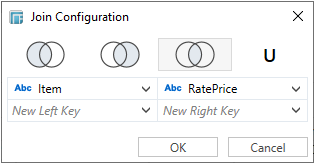
-
Select the left and right join keys.
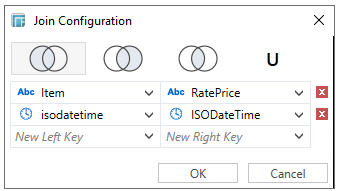
-
Again, select the join Type and click OK.
-
-
Left Outer Join

-
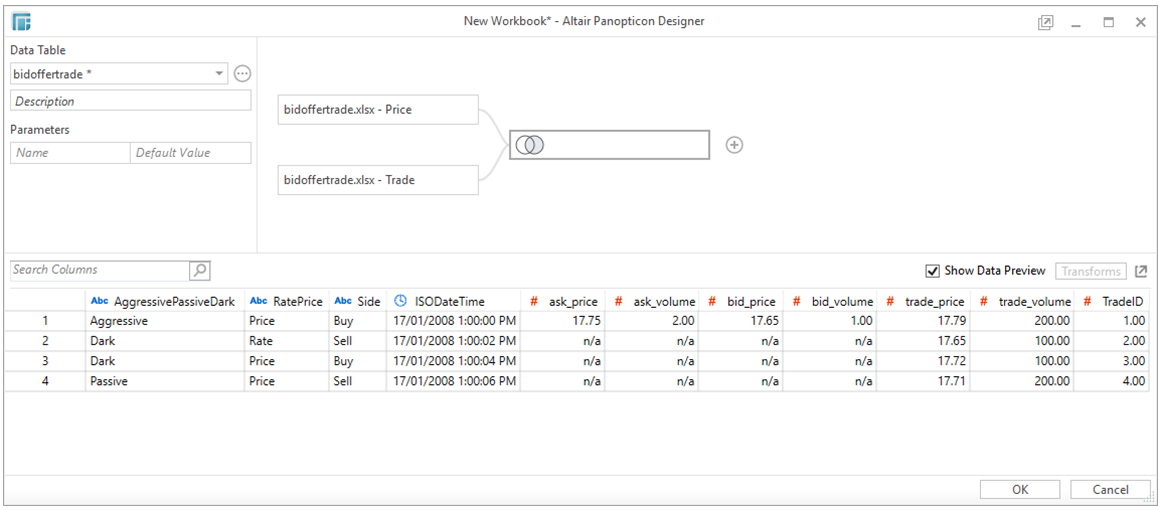
The joined table now displays three rows based on the Item and isodatetime join keys of the left table.
All of the rows from the left table are kept. Note that for the rows with no matching values from the right table, empty values are returned.
-
-
Right Outer Join

-
The joined table now displays four rows based on the RatePrice and ISODateTime join keys of the right table.
All of the rows from the right table are kept. Note that for the rows with no matching values from the left table, empty values are returned.
-
-
Inner Join

-
The joined table now displays one row based on the Item/RatePrice and isodatetime/ISODateTime join keys of both tables.
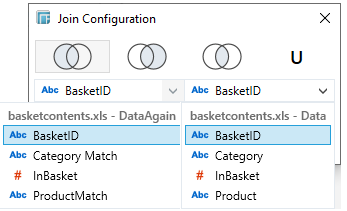
NOTE: A dataset cannot be by default joined to itself, as it is seen by the system as a single data source. To perform a Self Join, the dataset must be retrieved with different field name aliases, and then joined through an Inner Join.
In a basket analysis dataset, the Basket Identifier would be joined between the two data sources (Original, and Original with new aliases). This would then produce the correlation of products purchased within baskets.