


|
Adding a Time Series Legend
The Time series Legend displays configured reference lines, their associated labels, and visual members.
Adding a Time Series Legend
-
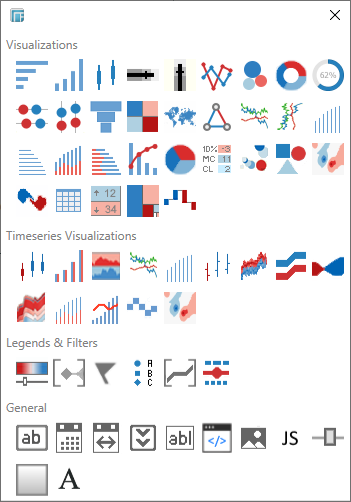
Draw a rectangle on the dashboard canvas to display the Parts dialog.
-
Click the Timeseries Legend
 icon in the Legends
& Filters section of the Parts
dialog box.
icon in the Legends
& Filters section of the Parts
dialog box.
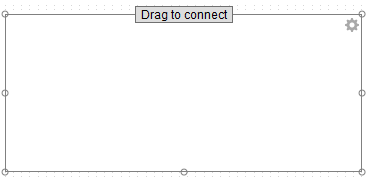
The Time series Legend part is displayed in the dashboard canvas. By default it appears empty.
-
Select the legend.
-
The Drag to Connect icon will appear at the top of the Legend.
-
-
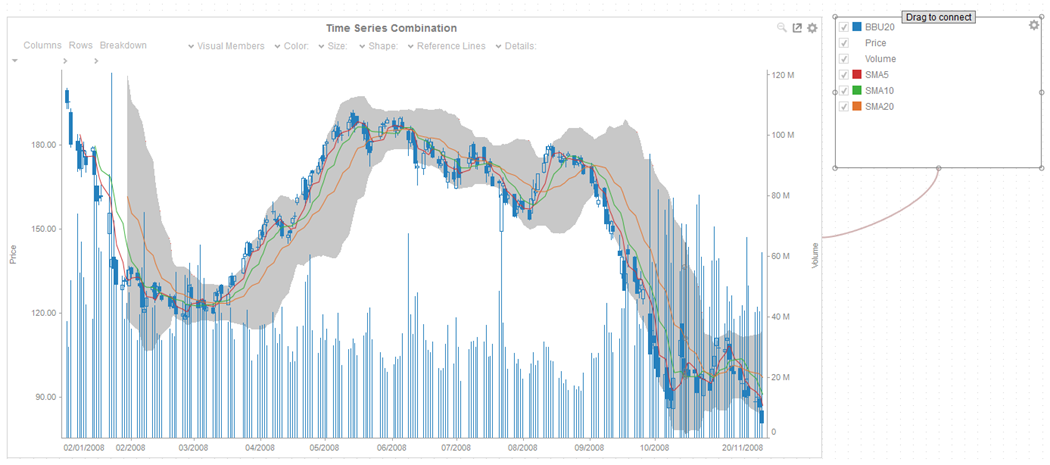
Click on Drag to Connect and drag to the desired parent visualization. Release the mouse.
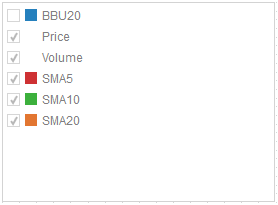
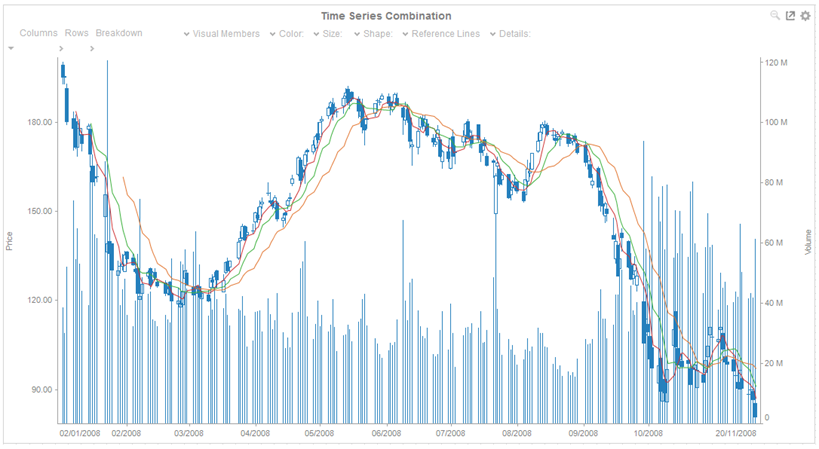
The legend is now connected to a parent visualization. It will retrieve the reference line listing from this visualization and display the constituent reference lines in a vertical column along with their associated labels.
The link between the legend and parent visualization is visible in the Panopticon Designer (Desktop). You can change this and connect to a different visualization by re-doing the Drag to Connect step.
NOTES:
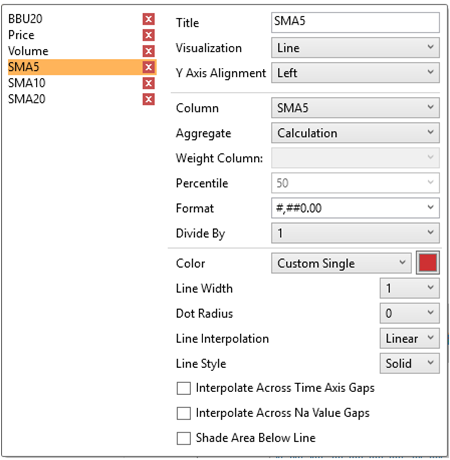
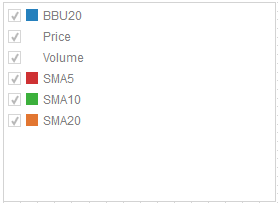
In the example above, for BBU20, SMA5, SMA10, SMA20, the square represents the configured Custom Single color for each visual member.
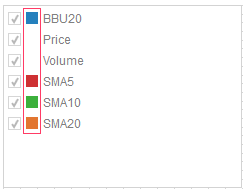
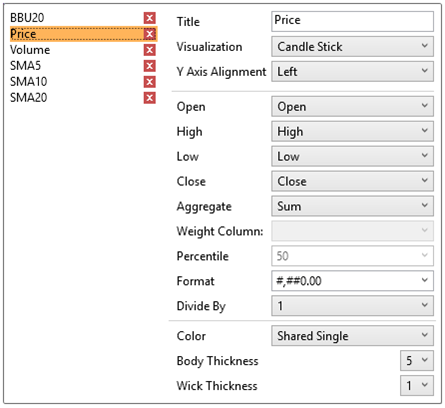
For the Price and Volume members, there is no configured Custom Single color.
Setting the Custom Single color for the visual members helps display the Color Legend for layers in the Combination Graph, in cases where the Color variable is not used.
-
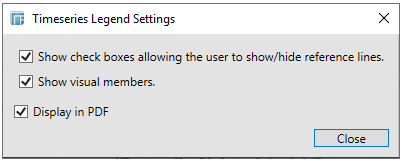
The Time series Legend properties are accessed by clicking Settings.

This displays the Timeseries Legend Settings.
-
-
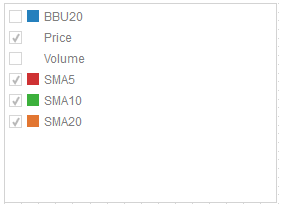
Checking Show check boxes allows users to display all or some of the reference lines in the visualization.
-
For example, if the BBU20 box is unchecked:
The reference line for BBU20 will not be displayed.
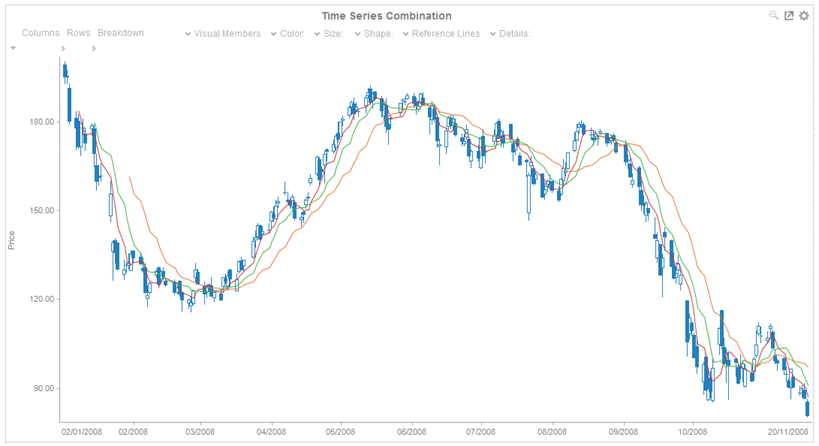
If Volume is unchecked:
-
-
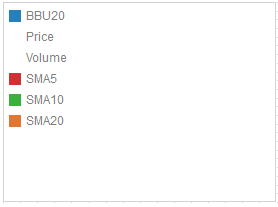
Unchecking Show check boxes disables the option to display or hide reference lines.
-
-
-
Checking Show Visual Members allows users to display or hide visual members in the Time Series Legend.
-
-
-
Unchecking Show Visual Members hides the visual members in the Time Series Legend.
-

-
Check the Display in PDF box to include this dashboard part in the PDF output.