


|
Price Band Graph Settings
The Pricing Band Graph displays the variance or spread between two time-based metrics.
Each grouping defined in the breakdown will be displayed as a separate layer of the overall graph, where typically color is used to display the category.
As it is expected that spread layers will occlude, the transparency is defaulted to 50% and can be modified as appropriate.
Typical use cases include comparing the pricing bid offer spreads from multiple liquidity providers.
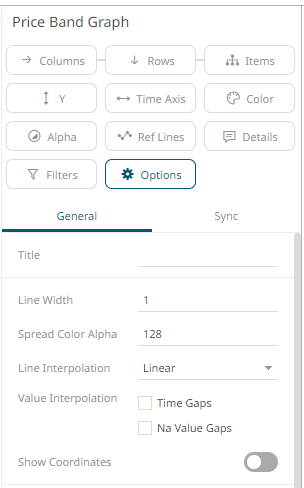
The price
band graph settings pane is displayed after clicking the Options  button.
|
Setting |
Description |
|
Line Width |
Select the line width (in pixels) |
|
Spread Color Alpha |
Specifies the level of color transparency/opacity for the Positive and Negative Spread colors. The value is from 0 to 255 with the default set to 128. |
|
Line Interpolation |
Specifies whether the line is Stepped, Linear, or Smooth interpolation. |
|
Value Interpolation Time Gaps |
Determines whether time axis gaps (Working Week/Time) are interpolated. |
|
Value Interpolation Na Value Gaps |
Determines whether Na value (or missing) gaps are interpolated |
|
Show Coordinates |
Determines whether the graph coordinates (i.e., X-Y plots, or Date/Time-Y plots) on mouse over are displayed in the visualization. |
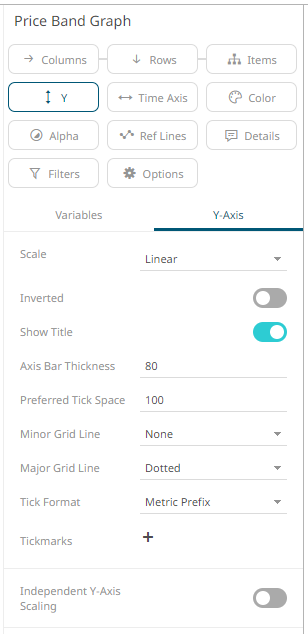
Other visualization-specific properties can be set by clicking on the Y-Axis variable drop area and then selecting the Y-Axis tab:
|
Setting |
Description |
|
Independent Y-Axis Scaling |
Determines whether to have each visualization Y-axis in a cross tab automatically scaled independent of the others. |