


|
Needle Graph Settings
Needle Graphs display time-based transactions or occurrence frequencies, rather than time-based trends. They are simply time-based Bar Graphs where each bar is located at a particular time point on the axis.
They work especially well when combined with a Line Graph.
The most common use of a Needle Graph is when showing the trading volume for a stock, typically underneath the price performance.
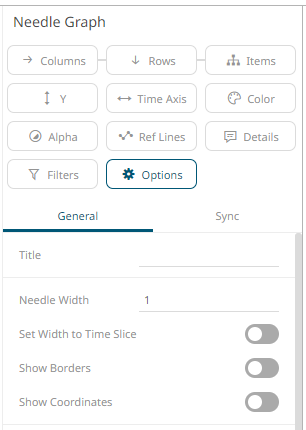
The needle
graph settings pane is displayed after clicking the Options  button.
|
Setting |
Description |
|
Needle Width |
Specifies the width in pixels for each needle: |
|
Set Width to Time Slice |
Determines whether the Needle width will be extended to the width of the time slice. NOTE: Will not go past a null/empty time slice. |
|
Show Borders
|
Determines whether borders are drawn around needles. These are only visible if the Needle Width is greater than 1 pixel. |
|
Show Coordinates |
Determines whether the graph coordinates (i.e., X-Y plots, or Date/Time-Y plots) on mouse over are displayed in the visualization. |
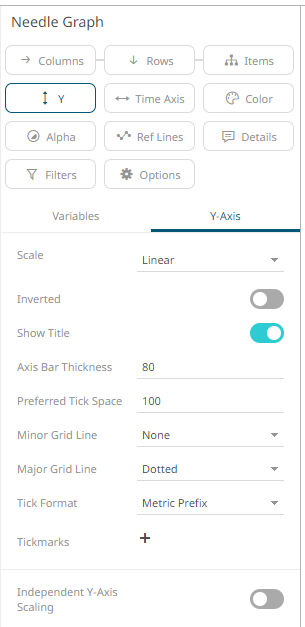
Other visualization-specific properties can be set by clicking on the Y-Axis variable drop area and then selecting the Y-Axis tab:
|
Setting |
Description |
|
Independent Y-Axis Scaling |
Determines whether to have each visualization Y-axis in a cross tab automatically scaled independent of the others. |