


|
Table Visualization Settings
A table can be used to display a small dataset where all the values are visible or the aggregate values of a larger data set.
The table can be configured to show hierarchies, allowing sub totals and grand totals to be displayed. Additionally, branches of the hierarchy can be expanded and collapsed.
The table can be sorted by clicking on a column heading, and sorting is applied across the defined hierarchy.
Columns widths can be adjusted manually or automatically, and columns can be hidden when required.
Columns cells can be represented in their value form or, alternatively, graphically as a series of micro-charts including:
q Bullet Graph
q Bar Graph
q Dot Plot
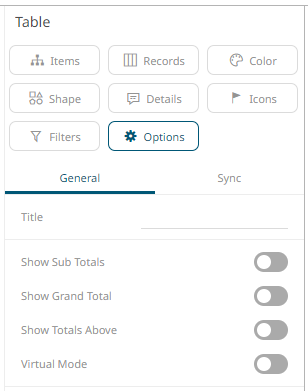
The table
settings pane is displayed after clicking the Options  button.
|
Setting |
Description |
|
Show Sub Totals |
Determines whether Sub Total aggregate rows are shown in the table. |
|
Show Grand Total |
Determines whether the Grand Total aggregate row is shown in the table. |
|
Show Totals Above |
Determines whether the Grand Total or Sub Totals are displayed above the rows in the table. |
|
Virtual Mode |
Determines whether the table will be in a virtual or flat mode in the Web client. If so, the collapse and expand options will not be available. |
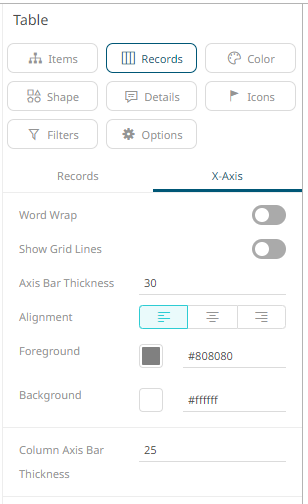
Other visualization-specific properties can be set by clicking on the Records variable drop area and then selecting the X-Axis tab:
|
Setting |
Description |
|
Word Wrap |
Determines whether to wrap the X-axis text. |
|
Show Grid Lines |
Determines whether grid lines are drawn on the X-axis. |
|
Axis Bar Thickness |
The margin in pixels for the axis. If set to zero, the axis is removed. |
|
Alignment |
The
alignment of the column text header: Left
|
|
Foreground |
Foreground color of the X-axis. |
|
Background |
Background color of the X-axis. |
|
Column Axis Bar Thickness |
The thickness of the bar from the column axis. |
 , Center
 , or
, or  .
.