|
Categorical Line Graph Settings
Line Graphs are easy to understand and are a great way to communicate important time-based trends, clustering, relative performance and outliers.
However, on occasion the axis is not time, but instead categorical. In this case a categorical line graph is used.
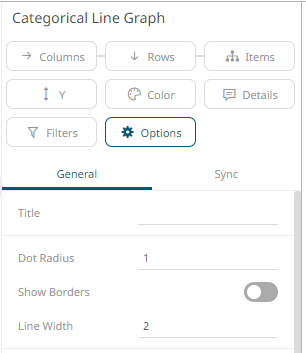
The categorical
line graph settings pane is displayed after clicking the Options  button.
|
Setting |
Description |
|
Dots Radius |
Specifies the radius of each dot in pixels. |
|
Show Borders |
Determines whether a border is drawn around each dot. |
|
Line Width |
The line width. |
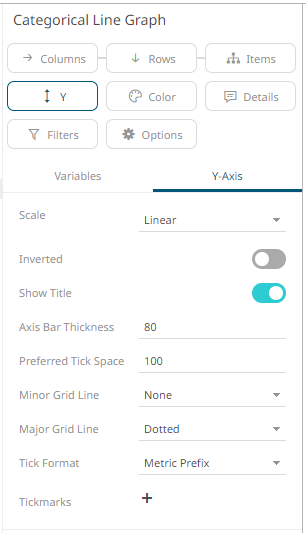
Other visualization-specific
properties can be set by clicking on the Y-Axis  variable
drop area and then selecting the Y-Axis tab:
variable
drop area and then selecting the Y-Axis tab: