|
Bullet Graph Settings
Bullet Graphs were designed by Stephen Few to remove unnecessary clutter and instead focus on visualizing metrics like Key Performance Indicators (KPI).
Research has shown that bullet graphs are easier to interpret in less time than the radial gauges or speedometers often seen in BI dashboards.
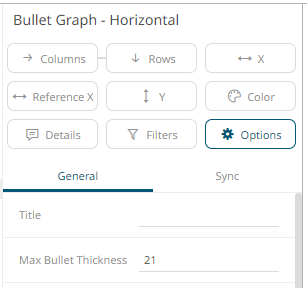
The bullet
graph settings pane is displayed after clicking the Options  button.
|
Setting |
Description |
|
Max Bullet Thickness |
Specifies the thickness of the graph in pixels. |
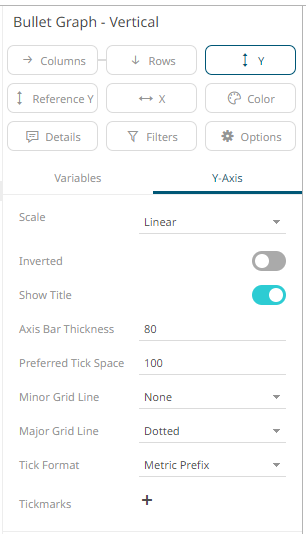
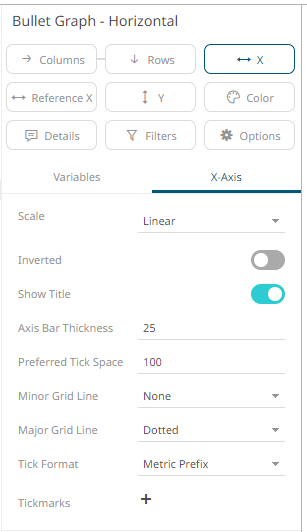
Other visualization-specific properties can be set by clicking on either:
q Y-Axis variable drop area then selecting the Y-Axis tab (for Vertical Bullet Graphs) or
q X-Axis variable drop area then selecting the X-Axis tab (for Horizontal Bullet Graphs)
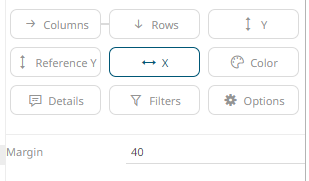
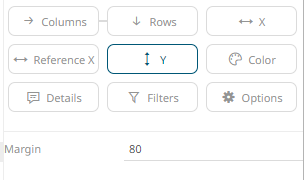
Furthermore, there is the X-axis setting (for Vertical Bullet Graphs) or Y-Axis setting (for Horizontal Bullet Graphs):
|
Setting |
Description |
|
Margin |
The margin in pixels for the axis. If set to zero, the axis is removed. |
NOTE |
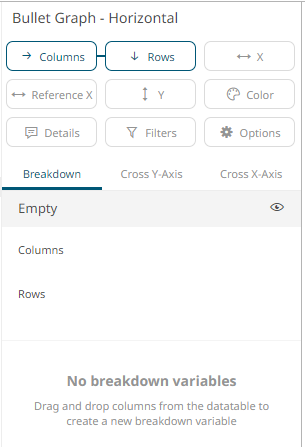
· Breakdown Items drop area is not available in the Bullet Graph.
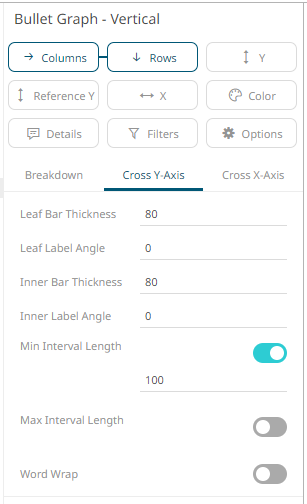
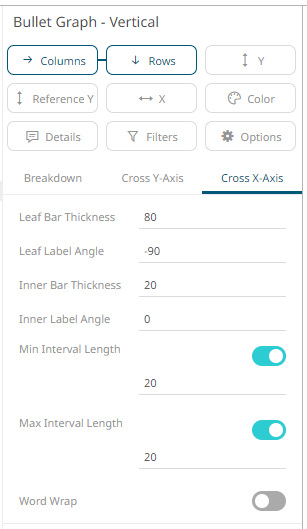
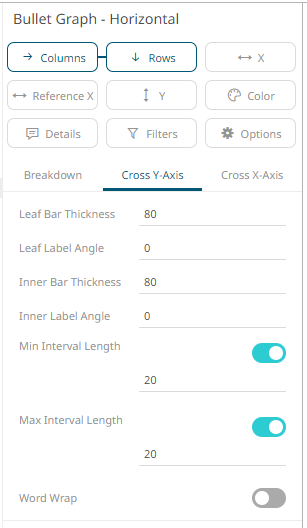
· Old breakdowns that have text columns in the Items drop area of the breakdown will be automatically updated and those text columns will be moved to the Columns drop area. · The Bullet Graph – Vertical visualization has the following specialized default properties:
In the Cross Y-Axis: o Leaf Bar Thickness – 80
In the Cross X-Axis: o Leaf Label Angle – 90 o Min Interval Length – 20 o Max Interval Length - 20 · The Bullet Graph – Horizontal visualization has the following specialized default properties:
In the Cross Y-Axis: o Min Interval Length – 20 o Max Interval Length - 20
|