|
Bar Graph Settings
Bar Graphs are probably the best-known visualization for quantitative data.
You can display Panopticon Bar Graphs either horizontally or vertically. These graphs are available in three variants:
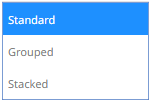
q Standard
q Grouped
q Stacked
In each case, you can sort the layout of the bar graph according to your requirements, and, with hierarchical data, the graph represents the netted position at each aggregated depth level.
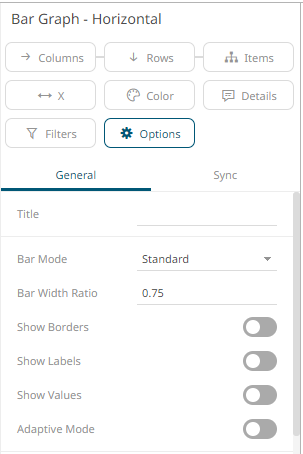
The bar graph
settings pane is displayed after clicking the Options  button.
|
Setting |
Description |
|
Bar Mode |
Specifies the mode of the bar graph, which can be Standard, Stacked, or Grouped.
|
|
Bar Width Ratio (%) |
Defines the ratio of the width within the bars. Default is .75. |
|
Show Borders |
Determines whether borders are drawn around bars or stacks within bars. |
|
Show Labels |
Determines whether labels are drawn inside the bars or not. |
|
Show Values |
Determines whether values are displayed on each bar or not. |
|
Adaptive Mode |
Automatically swaps to the Standard mode when displaying the top items within a hierarchy. |
|
Value Margin |
The width of the margin of the Values from the border. |
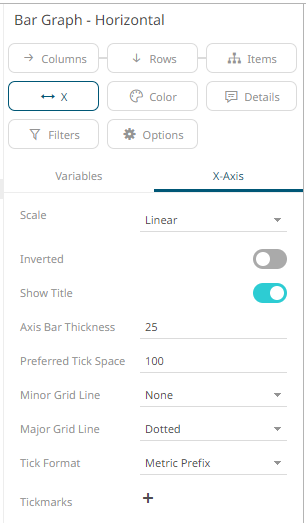
Other visualization-specific properties can be set by clicking on either:
q Y-Axis variable drop area then selecting the Y-Axis tab (for Vertical Bar Graphs) or
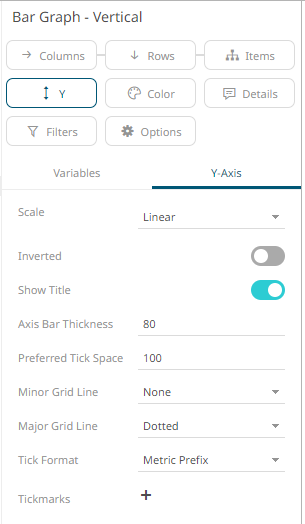
q X-Axis variable drop area then selecting the X-Axis tab (for Horizontal Bar Graphs)