


|
Reference Lines Variable Configuration
You can add a horizontal or vertical line to your chart (for this example, Scatter Plot) to indicate key values, important aggregates or dates, etc. Adding the Y column to a Reference Lines variable can produce this visualization:
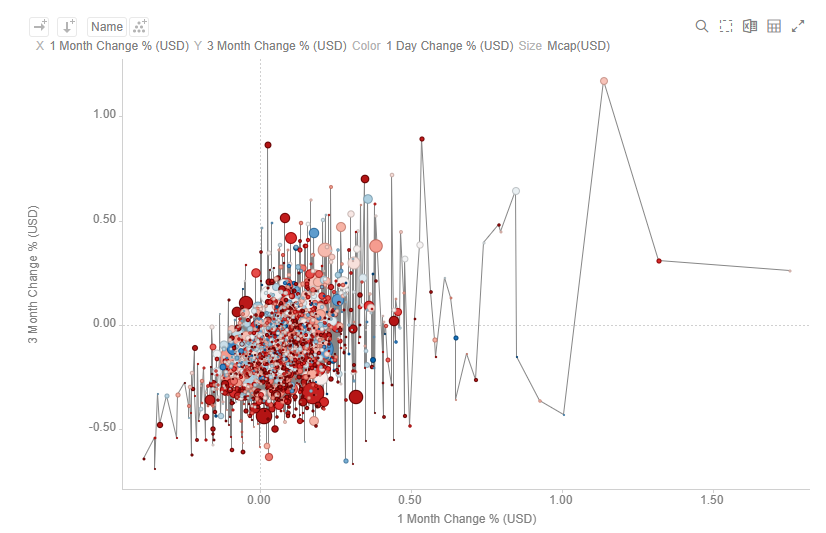
For this sample, after adding the same column used for the Y-axis (3 Month Change % (USD)) as a Reference Line, all of the values on the Scatter plot are then taken and sorted horizontally along the X-axis, then a line is drawn between the values.
The Reference Line variable is available in the Table and all the time series visualizations (except in the Horizon Graph and Timeseries Surface Plot).
Steps:
1. To associate columns from the data table, drag and drop them to the Reference Lines variable drop area. Select one to display the corresponding configuration pane.
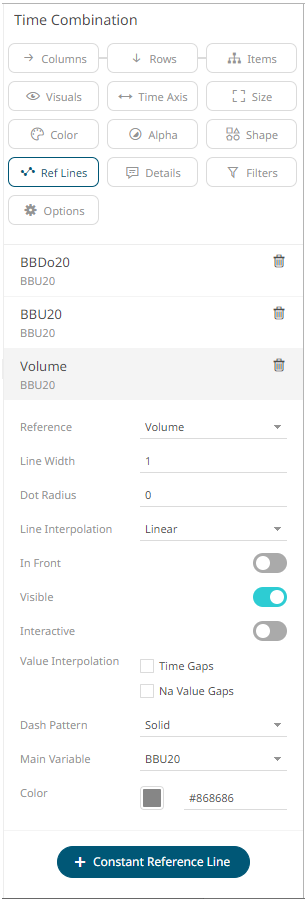
2. You can opt to change the column to the be used as the Reference Lines variable from the Reference drop-down list.
3. Specify the Line Width. Default is 1.
4. Specify the Dot radius (in pixels) of each data point. Default is 0.
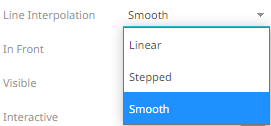
5. Select the Line Interpolation: Linear, Stepped, or Smooth.
6. Tap the In Front slider to display the lines in front of the scatter points.
7. Tap the Visible slider to enable the reference line of added columns. This is enabled by default.
8. Tap the Interactive slider to apply the interactive parameters of the column.
9. Enable:
· Interpolate Time Gaps
· Interpolate Na Value Gaps
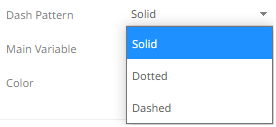
10. Select the Dash Pattern: Dotted, Dashed, or Solid.
11. The Main Variable field displays the selected column that will be used as the main variable of the reference line.
12. Set the line color of an added column either by:
· clicking the corresponding Color box to display the Color dialog to:
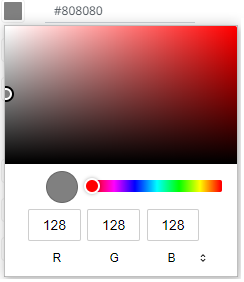
¨ select the color, or
¨ click  to
enter the values
to
enter the values
for RGB
for HSL
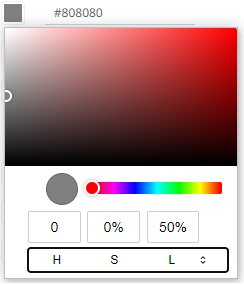
for the Hex color code
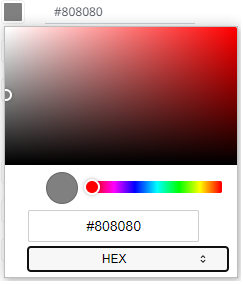
¨ or enter the Hex color code
13. Click  . A new constant
reference line is added under the Reference Lines list.
. A new constant
reference line is added under the Reference Lines list.
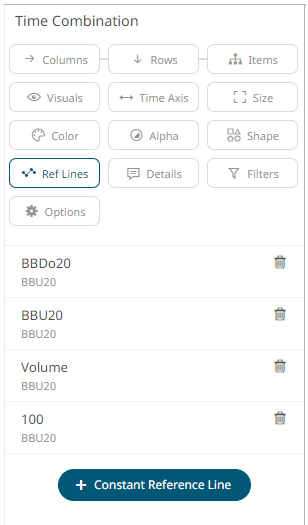
This value (e.g., 100) can be used as point of reference as compared to the column values added in the Y-axis.
You can also perform steps 2 to 13 to the added constants.
14. Click the Save  icon on the toolbar.
When
saved, the  notification is displayed.