View Ray Tracing Text File
This option allows the user to visualize the information of the rays computed in the ray-tracing process in text format, allowing them to export these files in case they are needed for processing by external tools.
When the user selects this option, the following panel appears:
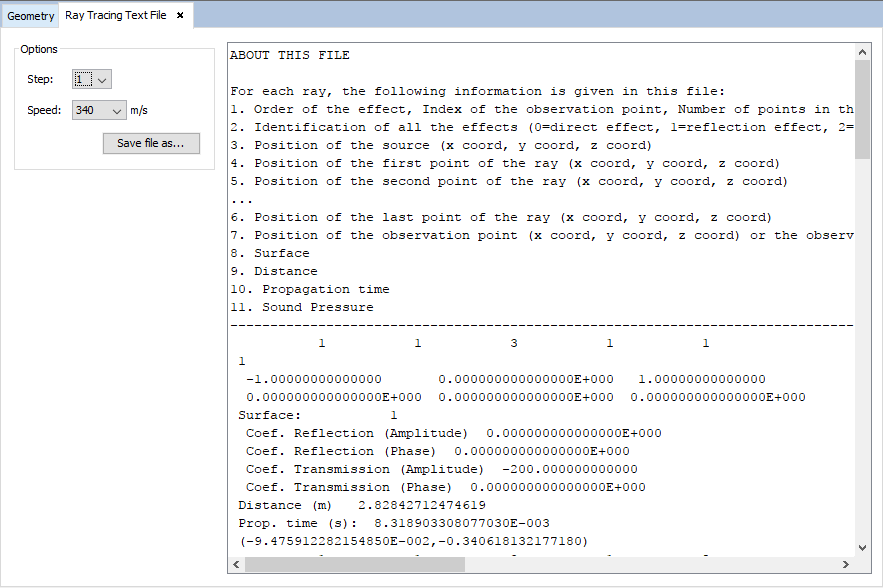
Figure 1. Figure Ray-tracing text file panel
In the left side of the panel, the user can select the parametric step and the speed of sound to show the results for. When any of these options is modified, the text area will immediately show the updated file. The user can export the currently shown file to a location in their hard drive by pressing the "Save as..." button and selecting the location in the dialog that will appear.
The information that the ray-tracing file shows, for each ray, is the following:
- The first line contains the order (number of effects), the observation point, the number of critical points of the ray path, the source that generates the ray and the first effect (more info on how to interpret this field in the next point). All these values are separated with spaces.
- The second line shows each one of the effects of the ray. Each effect is associated with a specific number, i.e. 0 = direct, 1 = reflected, 2 = diffracted, 3 = transmitted, and 4 = creeping.
- The following lines contain the coordinates of each critical point of the ray. The first point always matches the coordinates of the source that emits the ray. Subsequent points are the ones where the ray is reflected, transmitted or diffracted. The last point always matches the coordinates of the observation point.
- The next line shows the index (starting in 1) of the surface where the ray is transmitted, reflected or diffracted (in the case of a direct ray, this value is 0). If the ray is transmitted, reflected or diffracted, the next four lines will show the reflection and transmission coefficients of the surface. If the ray has multiple effects, the index of the surface and the reflection and transmission coefficients will be shown for each effect.
- The next line shows the distance the ray travels between being emitted by the source and arriving at the observation point, in meters.
- The next line shows the propagation time of the ray, in seconds.
- The final line shows the contribution of the ray to the sound pressure at the observation point, as a complex value given in rectangular form.
This content is repeated for each one of the rays computed in the ray-tracing process.