Show Results Menu
This menu contains several options that lets the user view the results generated by the simulation process. There are different kinds of results, some of them presenting tables, some of them presenting numerical results, some of them presenting plots and some of them presenting 3D views where the user can see visual results like the charges and currents analysis through the objects.
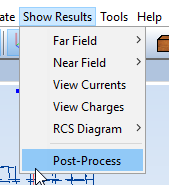
Figure 1. Show Results Menu
Most of plots show 2-D curves of a result field versus an input parameter. This type of graphics share aditional features of zoom, raxis and curves edition, and so on. To read more information about the chart options (when clicking on the rigth button over a chart) see Annex 1: Graphics Advanced Options.