Formatting the Font
Format the font of the Cartesian graph by searching and navigating the documentation.
-
To change the font sizes of the vertical and horizontal axes, look for Font in
the integrated help. Select the Font (property) topic and
then select the GraphAxisTitle (object).
This shows the Usage locations.
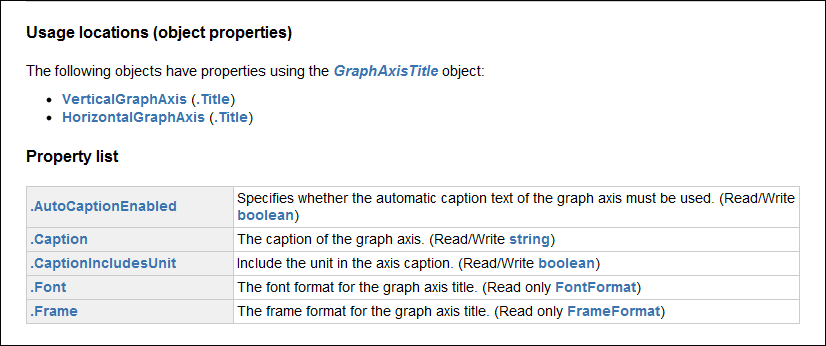
Figure 1. A snippet of the GraphAxisTitle object which shows the Usage locations and Property list. -
Under the Property list for the .Font
property select FontFormat.
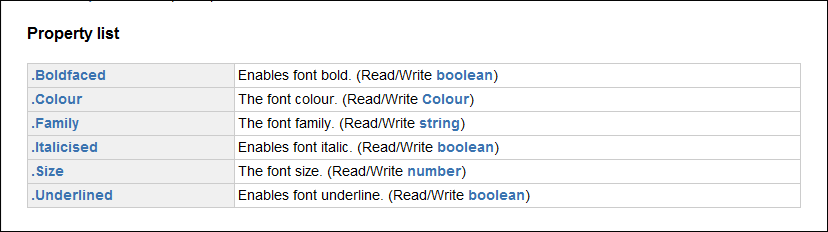
Figure 2. A snippet of the FontFormat object which shows the .Size property.Note: The .Size property is a number. From the last two figures some of syntax for adjusting the font is already clear:VerticalAxis.Title.Font
-
Navigate to the VerticalGraphAxis (object) and select
.VerticalAxis.
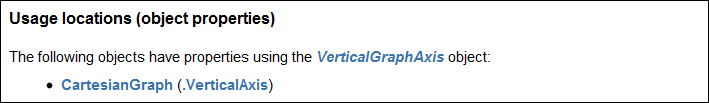
Figure 3. A snippet of the VerticalGraphAxis object which shows the Usage locations. -
Click .VerticalAxis at Usage
locations.
Note: There can be more than one graph, therefore the graph forms part of the collection of CartesianGraphCollection.

Figure 4. A snippet of the CartesianGraph object. -
Similarly use the .Labels property to adjust the font size
for the labels using the following syntax.
my_graph.HorizontalAxis.Labels.Font.Size = 14
my_graph.VerticalAxis.Labels.Font.Size = 14
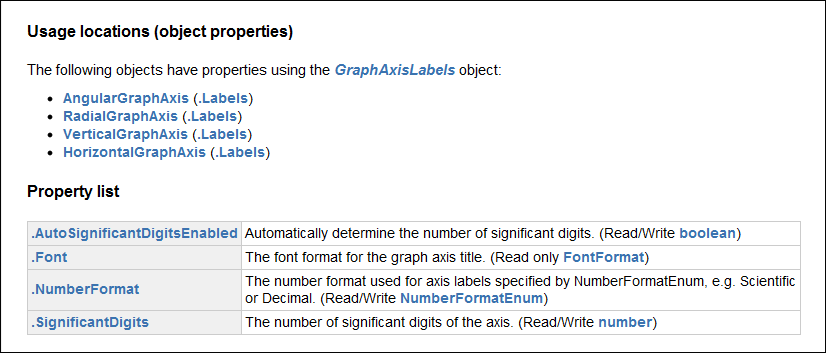
Figure 5. A snippet of the GraphAxisLabels object.