SimSolid performs meshless structural
analysis that works on full featured parts and assemblies, is tolerant of
geometric imperfections, and runs in seconds to minutes. In this tutorial,
you will do the following:
Calculate linearized stress along a line segment.
Model Description
The following model file is needed for this tutorial:
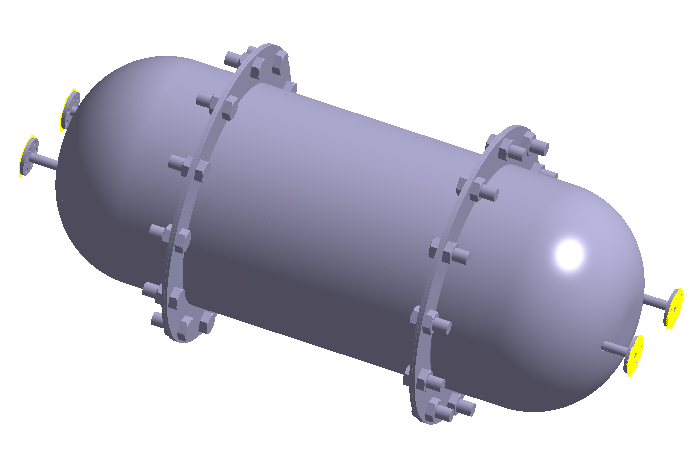
LinearizedStress.ssp
Figure 1.
This file has the following specifications:
Material is set to Steel for all parts.
Regular connections with 1mm gap and penetration tolerance.
Linear static subcase with pressure load and constraints, solution settings
set to Adapt for stiffness.
Open Project
Open the SimSolid project file.
Start a new SimSolid session.
Click the (Open Project) icon.
Figure 2.
In the Open project file dialog, choose LinearizedStress.ssp
Click OK.
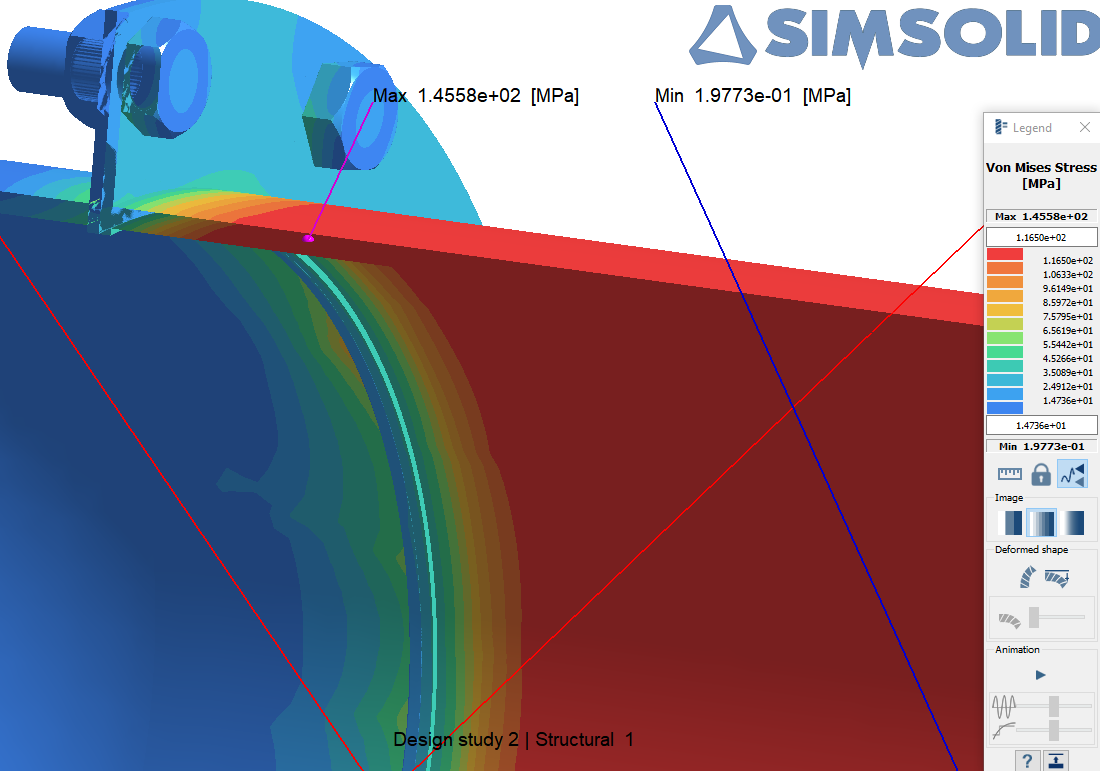
Review Model
Review the model and load case, and plot stresses.
In the Project Tree, expand the Structural
1Analysis Workbench.
Expand the Loads&Constraints branch and review the
loads.
Click (Results plot) and choose the desired plot to
review regions of high stress.
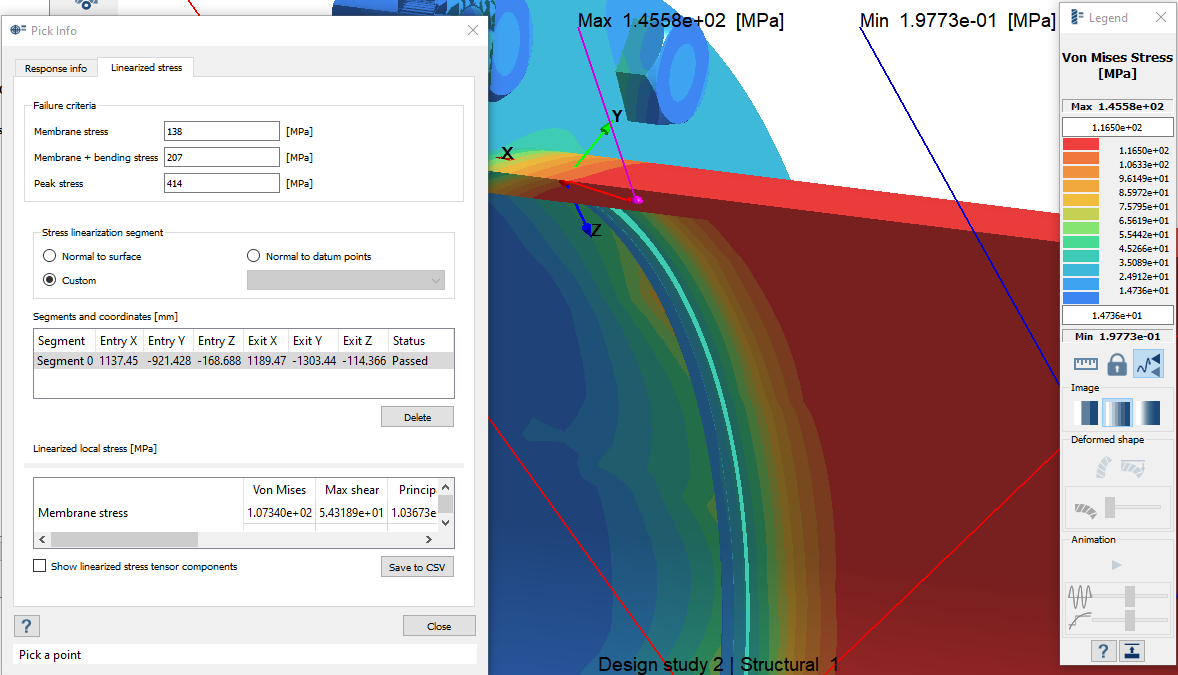
Method 1: Line Segment Normal to Surface
Calculate linearized stress on a line segment drawn normal to surface.
For Structural 1, on the Analysis Workbench select
(Pick info).
In the dialog, select the Linearized stress tab.
Review the default Failure criteria.
Defaults for failure criteria are calculated based on the Yield stress
of the material assigned in the project. Membrane stress = 2/3 of Yield
stress, Membrane + bending stress = Yield stress, Peak stress = 2x Yield
stress.
When multiple materials are present in the project, the material with
the highest yield stress is used to calculate the default.
You can edit these values before or after the linearized stress
calculation.
Draw the line segment normal to surface.
Ensure the Normal to surface radio button is
selected.
Select the point of interest in the modeling window.
Figure 3.
SimSolid launches a ray that is
normal to the surface and passes through the part.
A local coordinate system is created with the X axis along the
segment.
Entry and exit coordinates of the segment are listed in the
dialog.
Linearized stress along the local coordinate system is
calculated for the segment and the values are listed in the
dialog. By default, invariants are listed.
The Status will show "Passed" as long as the invariants are
below the failure criteria.
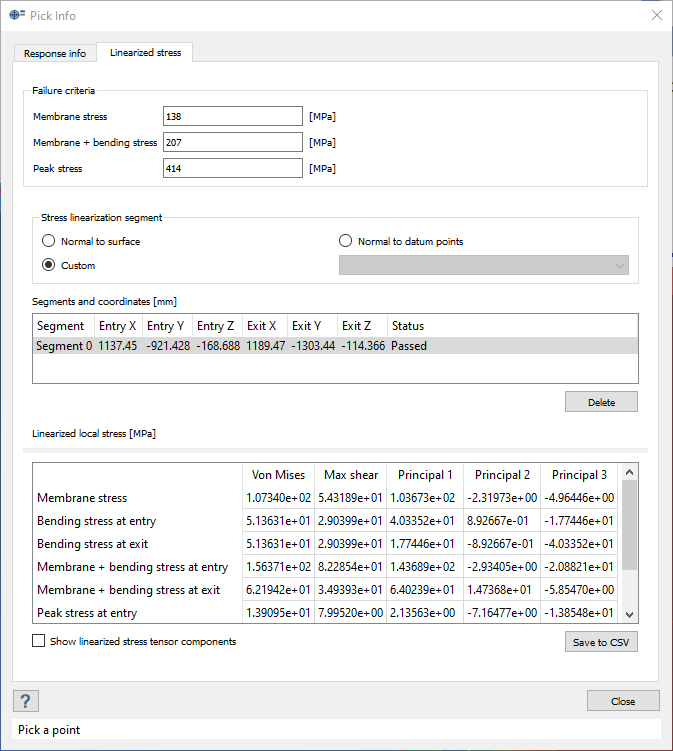
Select the Show linearized stress tensor components
check box to view the stress tensor components.
Method 2: Line Segment on Custom Location
Calculate linearized stress on a line segment drawn at a custom location.
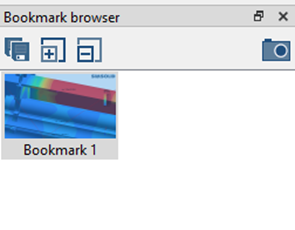
In the Bookmark browser, click Bookmark 1.
Figure 4.
Stress vonMises is plotted and the model is oriented with max vonMises
location in view.
On the main window toolbar, click
(Clip assembly with plane).
On the model, press Control + left mouse button to cut
along the max stress region.
Click Shift and scroll with the mouse to move the
display toward the max location.
Figure 5.
For Structural 1, on the Analysis Workbench select
(Pick info).
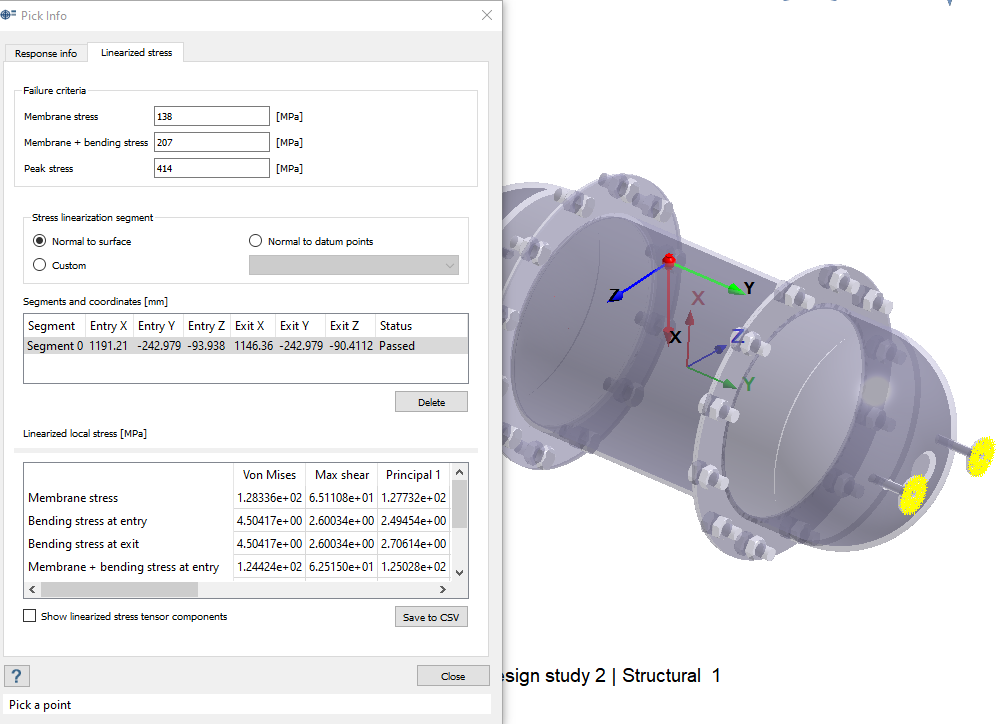
In the dialog, select the Linearized stress tab.
Under Stress linearization segment, activate the Custom
radio button.
In the modeling window, select two points on the model
to draw a line segment.
Figure 6.
As with Method 1, the linearized stress calculation is performed and
values are posted in the table in the Pick info dialog. Figure 7.
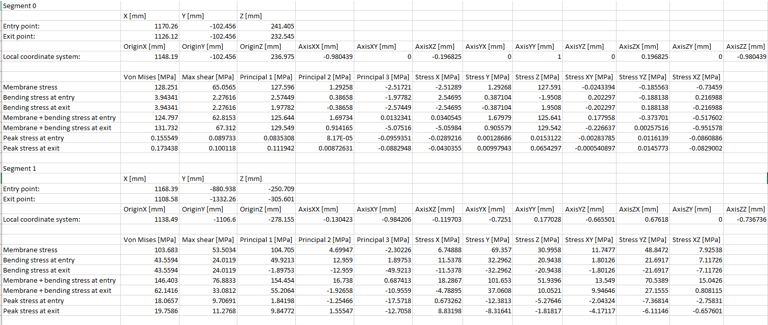
Save to CSV
Save the linearized stress values to a .csv file.
In the Pick info dialog, click Save to
CSV.
The values for all line segments are written into a
.csv file as shown in Figure 8. Figure 8.
Optional: Edit Failure Criteria
Edit the failure criteria for linearized stress calculations.
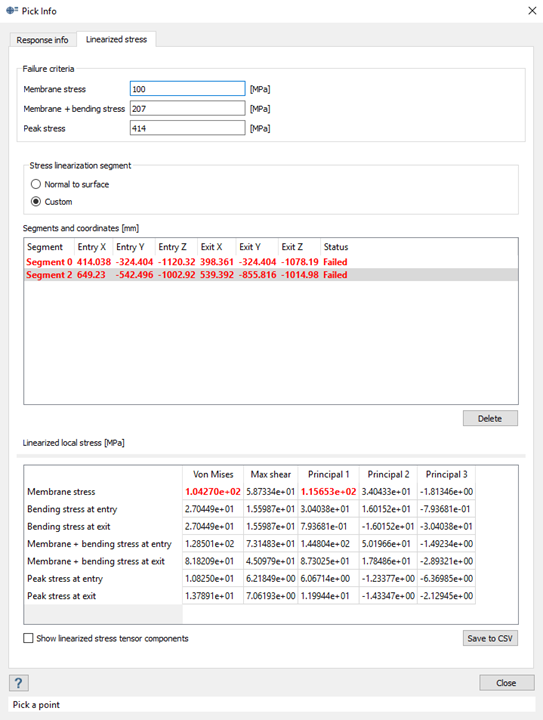
In the Pick info dialog under Failure criteria, set the
Membrane stress to 100.
Figure 9.
Cells with Membrane stress above 100MPa are shown in red. The line segment
status is changed to "Failed" and the segment is shown in red.
 (Open Project) icon.
 (Results plot) and choose the desired plot to
review regions of high stress.
(Results plot) and choose the desired plot to
review regions of high stress.
 (Pick info).
 (Clip assembly with plane).