SS-V: 6030 Simply Supported Thin Square Plate - Frequency Response
Test No. VD04View frequency response of a simply
supported square plate.
Definition
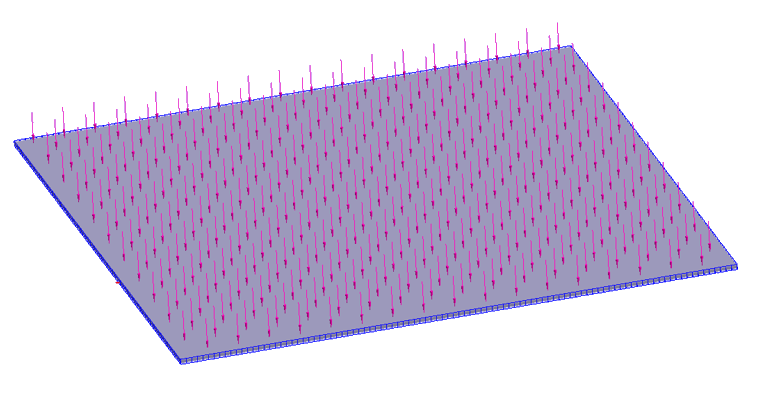
A simply supported thin square plate 10 x 10 x 0.05 m is subject to uniform pressure
P=100 Pa which changes in time as the following function.(1)
Where,
Excitation frequency.
Sixteen (16) modes are used to approximate dynamics solution and 2% modal damping is
assumed in all modes.
The material properties are:
Properties
Value
Modulus of Elasticity
2.e+11 Pa
Poisson's Ratio
0.3
Density
8.e+3 kg/m3
Note: This test is similar to Test VD01, but it is solved in frequency
domain.
Results
The plate is simulated as a 3D solid body. Spot-lines were
created at the mid-plane of the plate in order to apply hinge supports (Figure 1). Figure 1.
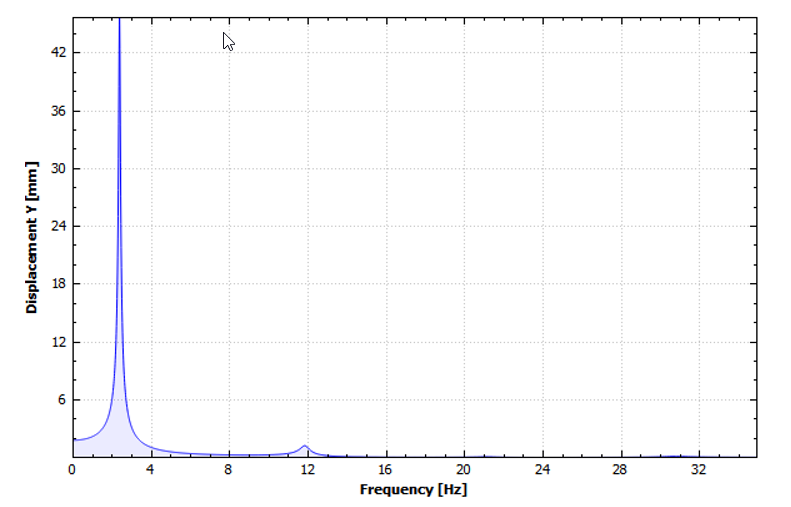
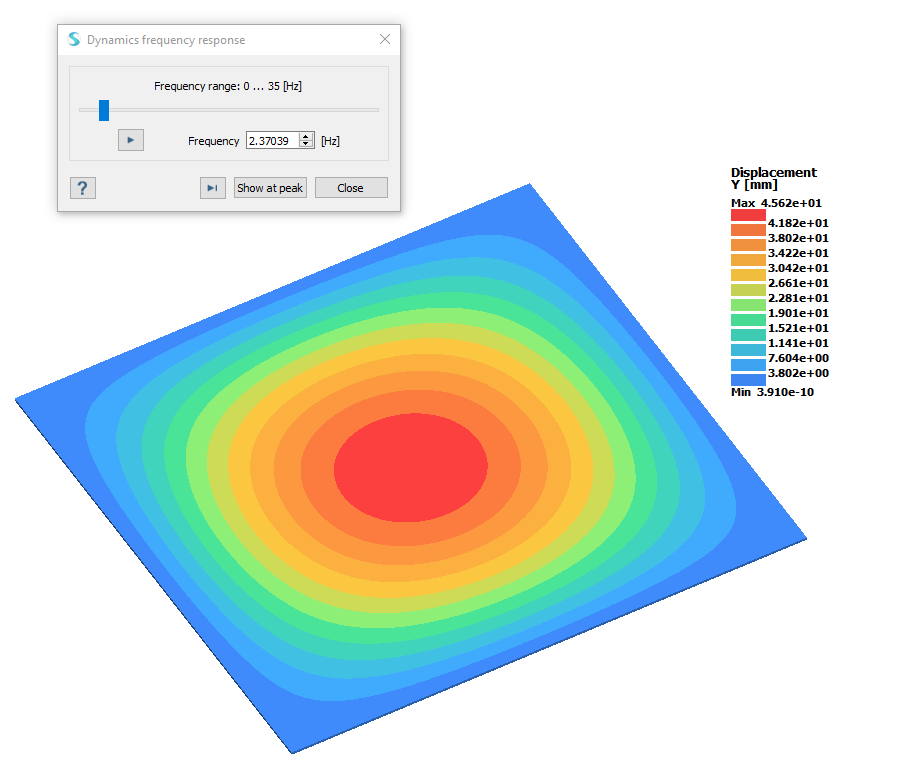
Peak response is reached when excitation frequency becomes equal to
first natural frequency of the plate. Figure 2 shows frequency sweep result for
Y-displacement amplitude in picked point with coordinates [m] X = 4.9469, Y = 0.05.,
Z = -4.9158. Figure 2. Figure 3.
The following table contains peak response comparison.
Deflection Y Amplitude,
mm
Surface Stress Amplitude,
MPa
45.68
32.52
SimSolid, 3D solid model
45.42
35.08
Reference, thin plate model
1 Test 13H
from NAFEMS Publication R0016, “Selected Benchmarks for Forced Vibration” J.
Maguire, D.J. Dawswell, L. Gould