SS-V: 4030 Coupled Thermal-Structural Analysis - Constrained Straight Bar Under Linear
Temperature Field
Test No. VTL04Determine stresses at the top and bottom
of a constrained straight bar under linear temperature field.
Definition
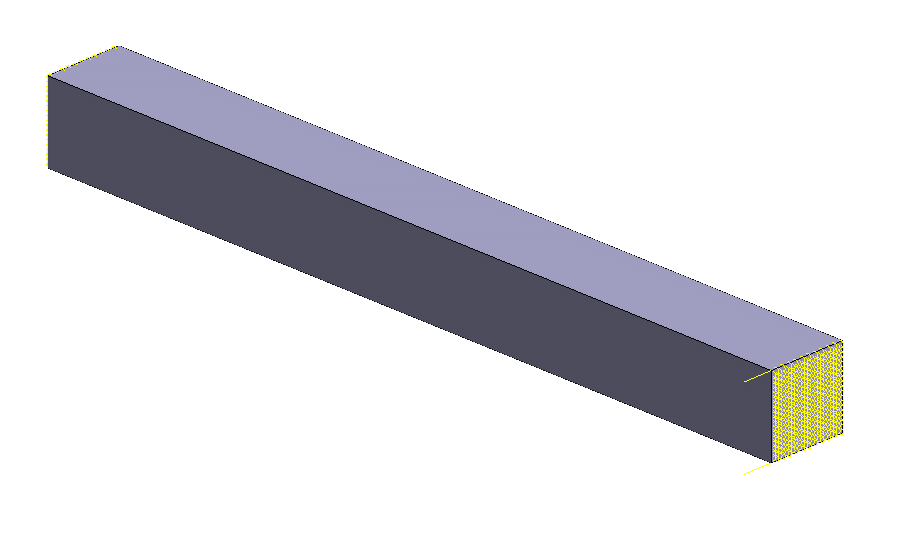
A straight 1 x 1 x 10 mm bar (Figure 1) is constrained at ends and is thermally
loaded. A uniform temperature of 100 degress Celsius is applied to the top of the
bar, and a uniform temperature of -100 degrees Celsius is applied to the bottom of
the bar. The rest of the bar surfaces are insulated.
The material properties are:
Properties
Value
Modulus of Elasticity
2.1e+11 pa
Poisson's Ratio
0.3
Coefficient of thermal expansion
1.2e-5 m/m-C
Thermal conductivity
43 W/m-K
Figure 1. Figure 2.
Results
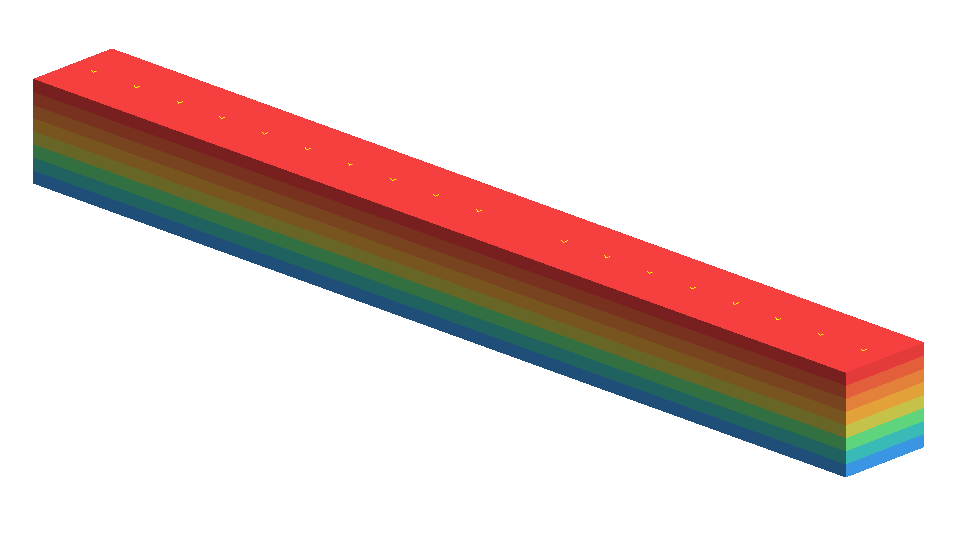
The bar is simulated using a 3D solid model. The
temperature distribution is obtained in thermal analysis (Figure 3). Temperature changes
linearly across the bar from 100 degrees Celsius at the top to -100 degrees Celsius
at the bottom. Figure 3. Temperature distribution
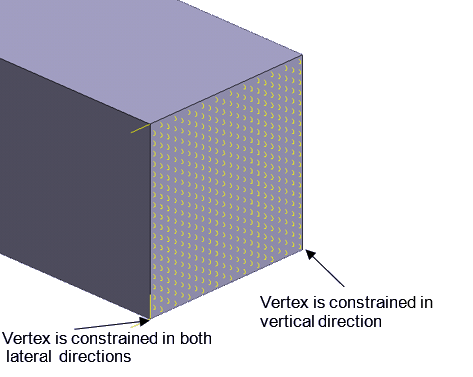
The obtained temperature field was used as input for structural
analysis. In order to make use of the reference data obtained for a 1D model of the
bar, the following constraints are applied: sliding supports are applied to end
surfaces of the bar and two vertices at one end of the bar are constrained in order
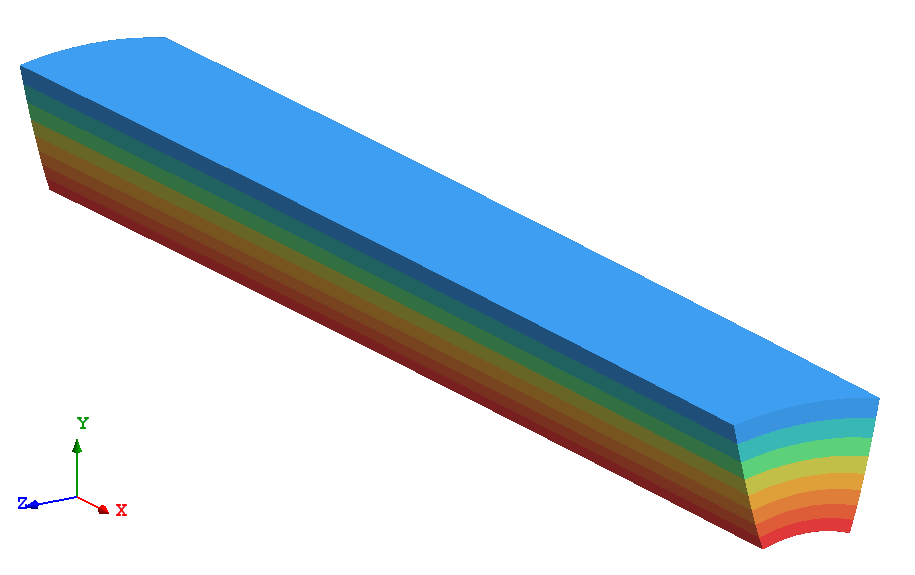
to eliminate rigid body motion of the bar (Figure 2). Figure 4. Bar deformation and stress X distribution
Ref Solution *
SimSolid
% Difference
Stress at the top/bottom of the bar (compression/tension)
[pa]
2.520E+08
2.516E+08
-0.17%
* Ref Solution is a 1D model
1 W.C. Young, R.G. Budynas,
Roark’s Formulas for Stress and Strain, Seventh Edition, McGraw-Hill Book Co.,Inc.,
2001, p. 759.