SS-V: 2050 Thick Square Plate
Test No. VM06Determine the first twelve modes and frequencies for a simply supported thick square plate.
Definition
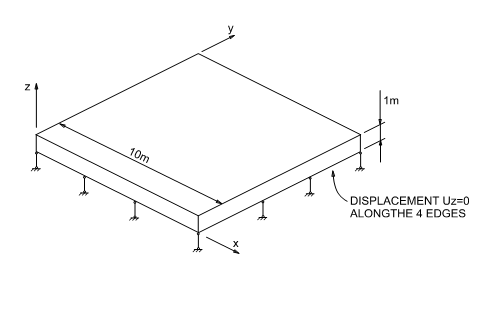
Figure 1.
The material properties are:
- Properties
- Value
- Modulus of Elasticity
- 2e+11 Pa
- Poisson's Ratio
- 0.3
- Mass density
- 8.3e+3 kg/m3
Results
The plate has three rigid body modes with zero frequencies. Vertical constraints are applied not at the middle plane of the plate, but to the lower edges. This does not allow for clear separation of out-of-plane and in-plane vibration modes. Also, in full 3D formulation constrained edges introduce stress singularity into the solution.
Additonal comments:
- The reference solution has a very rough FEA mesh with just a few elements. Mesh lines orientation and incompleteness of basis functions of iso-parametric elements results in artificial “anisotropy” of the approximation.
- Vertical constraints are applied not at the middle plane of the plate, but to the lower edges. This does not allow for clear separation of out-of-plane and in-plane vibration modes. This separation in NAFEMS results is because a very crude approximation is used. Also, in full 3D formulation the constrained edges are the source of a strong singularity in the solution.
- The High Order Element (HOE) solution has only one layer of elements across thickness with quadratic basic functions. Quadratic functions do not capture bending (you need 3rd order functions). The Low Order Element (LOE) solution has three layers of bricks across the thickness, but the basis functions are linear incomplete polynomials which also do not capture bending.
- An additional OptiStruct model was run with a high density
(800,000 element) mesh. Twenty linear HEX elements were used through the thickness
(Figure 2). This is felt to
be a better comparison.
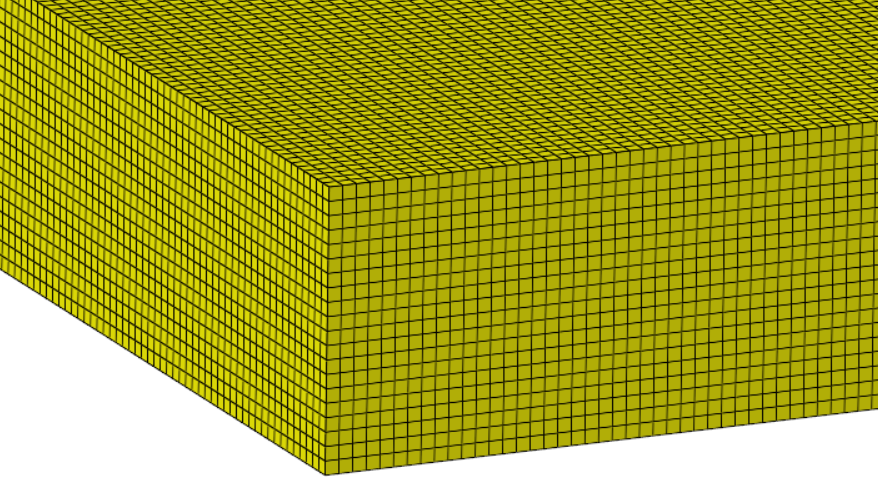
Figure 2. OptiStruct mesh
The following table summarizes the modes.
| OptiStruct | SimSolid | % Difference | NAFEMS | % Difference | |
|---|---|---|---|---|---|
| Mode 4 | 42.47 | 42.81 | 0.80% | 45.90 | -6.73% |
| Mode 5, 6 | 100.74 | 102.10 | 1.35% | 109.44 | -6.71% |
| Mode 7 | 147.89 | 151.10 | 2.17% | 167.89 | -10.00% |
| Mode 8 | 183.70 | 188.30 | 2.50% | 174.00 | 8.22% |
| Mode 9 | 185.37 | 189.50 | 2.23% | Not given | NA |
| Mode 10 | 193.59 | 193.50 | -0.05% | 193.59 | -0.05% |
1 The Standard NAFEMS
Benchmarks TNSB, Rev. 3, 5 October, 1990, Test No. FV 52