Toolbar Menu
Toolbar functions allow you to control model manipulation and animation.
Standard
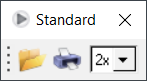 Figure 1.
 | Function | Icon | Description |
|---|---|---|
| Load Model | Allows you to locate and load an H3D file. To access the file browser, click
the Load Model icon on the toolbar. To open an H3D file:
or Use the browser to locate the file and click Open. This file is displayed. |
|
| Allows you to print the image displayed in the graphics area using the value
displayed in the Print Quality drop-down menu (see below on how to change the
print quality). To access the print dialog, click the printer icon on the
toolbar. Note: To print a complete HTML document, use the Print command under the
File menu in your browser.
To print to a printer:
|
||
| Print Quality | The quality of printing can be changed by selecting a higher resolution setting from the drop-down menu (ranging from 1x to 4x). Select the one times (1x) setting for coarse printing with fewer dots per inch (dpi), and the 4x setting for high quality fine printing with more dpi. The default setting is 2x. |
Animation
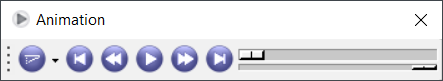 Figure 2.
 | Function | Icon | Description |
|---|---|---|
| Animation mode | Choose from either transient animation mode, modal animation mode, or linear animation mode. | |
| First Time/Angle/Step | Rewinds to the beginning of the animation. | |
| Previous Time/Angle/Step | Rewinds a single step of the animation. | |
| Start/Pause Animation |
|
Animates the model. Stops/pauses the animation. |
| Next Time/Angle/Step | Forwards a single step of the animation. | |
| Last Time/Angle/Step | Forwards to end of the animation. | |
| Current Time/Angle/Step |  |
Use the slider bar on the top right of the toolbar to view each frame
increment (or use the forward, |
|
Max Frame Rate (Frames/Sec) |
 |
The speed of the animation can be changed during playback. Move the slider
bar up to increase the animation speed (increase the frame rate). Move it down to
decrease the animation speed (reduce the frame rate). Note: The animation speed
also depends on the size of the model and the performance level of the hardware
in the workstation you are using.
|
View Control
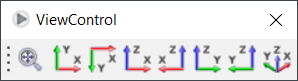 Figure 3.
 | Function | Icon | Description |
|---|---|---|
| Fit Model |
|
|
| XY Top Plane View | Set the view to the xy top plane | |
| XY Bottom Plane View | Set the view to the xy bottom plane | |
| XZ Left Plane View | Set the view to the xz left plane | |
| XZ Right Plane View | Set the view to the xz right plane | |
| YZ Rear Plane View | Set the view to the yz rear plane | |
| YZ Front Plane View | Set the view to the yz front view | |
| Isometric View | Set the view to the isometric view |
Display Controls
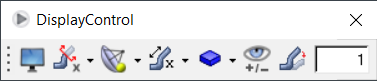 Figure 4.
 | Function | Icon | Description | |
|---|---|---|---|
| Display Control | Allows you to change the view of a model using
the display settings saved in the HyperView H3D file.
To access the Display Control menu, click the icon on the toolbar. The Display
Control menu, The following features can be displayed if they are captured during the saving of an H3D file from HyperView: |
||
| Tracing | Traces an entity during animation. A transparent image of the object is left behind at certain intervals along the path of motion. | ||
| Tracking | Tracks an entity during animation. | ||
| Contour | Displays a contour plot of your model. This allows you to see results represented as bands of color, based on the values returned from an analysis code. | ||
| Iso Value | Displays iso values for your model. | ||
| Tensor Plot | Displays a tensor plot of your model. | ||
| Vector Plot | Displays a vector plot of your model. | ||
| Legend(s) | Displays the legend. | ||
| Section Cuts | Displays a section cut through the model as previously defined in the model. This allows you to visualize the inside of the model. | ||
| Measures | Displays measures added to the model. | ||
| Notes | Displays notes applied to the model. | ||
| Sets | Displays the sets (groups) previously defined in the model. | ||
| Exploded View | Displays eroded elements in the model. | ||
| Symmetry | Displays the symmetry visualization previously defined in the model. | ||
| Axisymmetry | Displays the axisymmetry visualization previously defined in the model. | ||
| System Plot | Displays the Element, Material, or Ply coordinate system that is included in the H3D file. | ||
| FBD Plot | Displays the FBD plot visualization previously defined in the model. | ||
| SCL | Stress Classification Lines do appear in the list of options, however they are disabled and not supported currently in HyperView Player. | ||
| Realistic Rendering | Sets the rendering mode for the model to the physically based lighting mode. | ||
| Material Appearance | Sets the material appearance on the model. | ||
| Perspective | Displays graphics using true 3-D perspective. The following options are available:
|
||
| Boundary Geometry | Displays the boundaries of the model regardless of whether or not entities are displayed. Select Features to display the feature lines of the model, or select Transparent to display the model in transparent mode. | ||
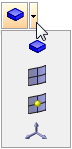
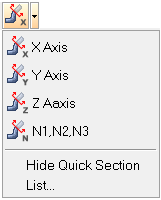
| Quick Section |  |
The Quick Section tool allows you to create a
section cut through a model. This is useful if you want to see details inside a
model. You can use this tool to define the plane of the section that you want to
view and then apply a section cut. You can also use the graphical manipulators to
modify the definition of the section cut, as well as translate or rotate sections
anywhere in 3-D space.
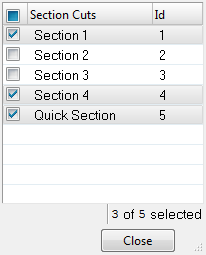 Use the check boxes to quickly turn on/off the display of the various section cuts in the graphics area. The table allows sorting of the section cuts by name or ID. This dialog can also be dragged and resized within the graphics area. Click Close to dismiss the List dialog (or you can also left click on the toolbar icon to dismiss the dialog). |
|
| Quick Tracking | The Quick Tracking mode allows you to track an
entity during animation. The model is animated with respect to the selected entity
This enables you to view the dynamics of a model as the selected entity remains in
the same location. Tracking systems can be defined using a node or a plane.
Use the radio buttons to quickly activate and turn on/off the display of a tracking system in the graphics area. The table allows sorting of the tracking systems by name or ID. This dialog can also be dragged and resized within the graphics area. Click Close to dismiss the List dialog (or you can also left click on the toolbar icon to dismiss the dialog). |
||
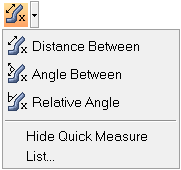
| Quick Measure | The Quick Measure mode allows you to measure
the distance between two nodes, or the angle between three nodes. Left-click the
Quick Measure mode button on the toolbar to start/enter the Quick Measure mode.
Note: The button will remain in a depressed state (an orange background is
displayed) to indicate the measure mode is active. This mode will remain active
until it is turned off (hit the Esc key on the keyboard or simply click on
another toolbar button to stop/exit the measure mode).
When the mode
is active, you can click the left mouse button to add a measure to the model.
Additional measures can also be added by clicking on the icon again (while the
mode is turned "on").
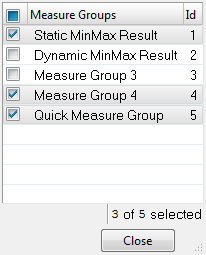
Use the check boxes to quickly turn on/off the display of the various measures in the graphics area. When a measure group is activated, it is included in the measure calculations and displayed on the screen. The table allows sorting of the measures by name or ID. This dialog can also be dragged and resized within the graphics area. Click Close to dismiss the List dialog (or you can also left click on the toolbar icon to dismiss the dialog). |
||
| Quick Query | The Quick Query mode allows you to query nodes,
elements, components, or systems. Left-click the Quick Query mode icon on the
toolbar to start/enter the Quick Query mode. The query mode will remain active
until it is turned off (right-click on the Quick Query icon to stop/exit the query
mode). When the mode is active, you can click the left mouse button to query nodes, elements, components, or systems in the model. The information that is displayed will depend on the type of entity selected. To change the
entity type that is being queried, click on the drop-down menu and select a new
entity type:
 The following information is displayed as a tooltip, according to
the entity selected:
|
||
| Show/Hide | The Show/Hide mode enables the control of the
model display by interactively selecting entities within the graphics area.
Click the Show/Hide mode icon on the toolbar to
activate the Show/Hide mode. The Show/Hide button will remain in a depressed
state (an orange background is displayed) to indicate the left mouse button is
in the Show mode and the right mouse button is in the Hide mode. The Show/Hide
mode will remain active until it is turned off (by clicking on the
Show/Hide icon again).
Note: When using the quick window selection (SHIFT+click-and-drag) an entity is
considered selected if any portion of it falls within the window; you do not
need to encompass the entire entity with the window, only a small portion of
it.
|
||
| Custom Deformation | The Custom Deformation mode enables you to
specify parameters for deformation display. This function can be used to see the
motion of your model after analysis. You can scale the deformed shape to see the
total amount of movement, or view the deformed shape by itself. Enter a value in the field (located to the right of the icon) to multiply the scale factor uniformly to components X, Y, Z and their displacements relative to the selected coordinate system. For the transient animation mode, the value is used to multiply the displacement to produce the deformed shape. For the modal and linear static animation modes, the deformed shape of the model is scaled so that the maximum deformation of the model is displayed as a specified percentage of the current model size. The model size is the diagonal length of the axis-aligned bounding box which contains all model geometry. Next, click the Custom Deformation mode icon on the toolbar to activate the Custom Deformation mode. You can also hit the ENTER key on the keyboard to display the specified deformation. The Custom Deformation button will remain in a depressed state (an orange background is displayed) to indicate the custom deformation mode is active. This mode will remain active until it is turned off (by clicking on the Custom Deformation icon again). |
||
Help Control
 Figure 12.
 | Function | Icon | Description |
|---|---|---|
| Help | Left-click on the Help icon to view the online help, or right-click on the
Help icon to view the various Help About information. For technical support, contact us at: Email: hvpsupport@altair.com Web: www.altair.com |
To turn on/off the display for selected toolbars, right-click in the display area and select from the Context sensitive menu. A check mark next to the selection means that it is displayed.
All of the HyperView Player toolbars are dockable (meaning they can be positioned anywhere within the window by dragging them with your mouse).