Results Explorer
Enables exploring the element force and moment results (internal loads) from solver result files (grid point forces) for further component sizing/optimization tasks and also for component certification/margin calculation.
- Launch HyperWorks Desktop and select the Aerospace user profile under Engineering Solutions.
- Import the solver input file.
- From the menu bar, click .
- Element forces (Nx, Ny, Nxy, Mx, My,Mxy)
- bar load
- shear plots
- Grid point forces
- Moments and shear/free body diagram
- Max/min sort of forces
- Envelop of forces
- Ranking of forces
This tool also accesses results from multiple results files, and performs derived loadcases created by linear superposition of existing loadcases using a load combination file (LCF).
To export all of the loadcases into a single .csv file or text file click Save All. A single file will be created for all of the loadcases selected.
Use Cases
- Default case: Create a report of element loads for the selected loadcases.
- Min Max: Find the elements where maximum or minimum values of select result components and the corresponding loadcases at which they occur.
- Ranking: Given selected elements and loadcases, you can find the top N elements where a given results type can occur.
- Envelop: For a given element, you can find the maximum values of a results type and its loadcase at which it occurs.
- Bar End Load: Adjusted axis force at each end of the bar due to panel shear.
- Shear Plot: Shear forces acting along the edge of a panel element.
- Panel Load: The force/unit length along and perpendicular to the boundary edges.
Load Combination File (LCF)
Use the load combination file to combine loadcases and create new loadcases (derived cases).
Derived case (D1) = L1 *SC1+L2*SC2+...
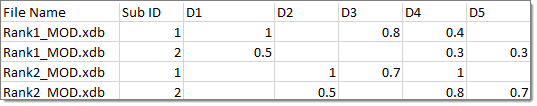
Figure 1. In this Example D4 (derived case) = LC1*0.4+LC2*0.3+LC3*1+LC4*0.8
Prepare the Results for the Explorer Tool
This is done in the following sequence:
Default Loadcase Results
In this case the raw results exported to an Excel file are for the selected elements, selected loadcases and the results type.
-
Click Query.
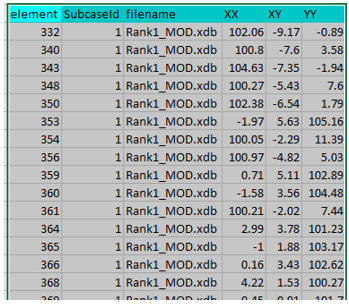
Figure 2. Separate Files are Created for each Loadcase
Mix Max Sorting
The minimum and maximum values are searched for all of the loadcases for the selected elements.
-
Select multiple data types for the max/min, which is required.
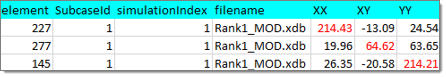
Figure 3. The Maximum XX, XY, YY Data Types and the Rest of the Corresponding Components in that Loadcase
Ranking
The goal of this use case is to find the top N values (rank=N) of a specific results data type and report for which element and loadcase they occur.
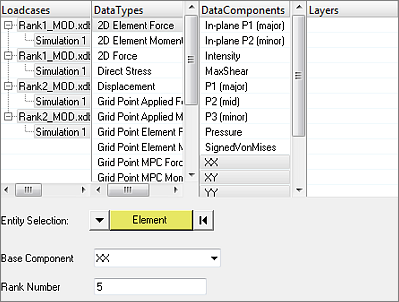
Figure 4. Ranking of the Top Five Values for the Component XX
-
Select the rank, which is the top N maximum results.
The output displays the top N results, their elements and loadcases. Other associated data components are also displayed, such as XX, YY.
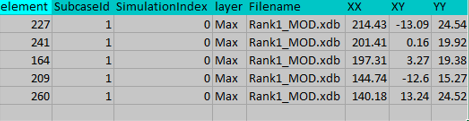
Figure 5. Top Five Values of XX Components and Element/Loadcases
Envelop
The Envelop tool outputs for each element the maximum values of selected results data type and the corresponding loadcase where it occurs.
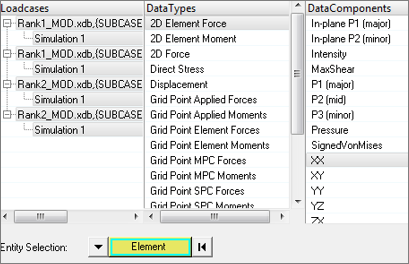
Figure 6. You Select the Single Data Component and Loadcases
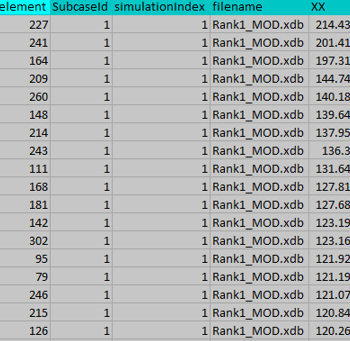
Figure 7. For each Element the Maximum XX Component and the Loadcase where it Occurs is Exported
Bar End Load and Shear Plot
- Bar End Load
- In bar element the axial force at each end is increased or decreased due
to the shear forces acting along the side of the shell elements attached
to them. These end loads are used in certification calculations.
- Shear Plot
- Calculate the shear load acting along each edge of a shell element for rivet load calculation or bar end load calculations. This is output as force per unit length.
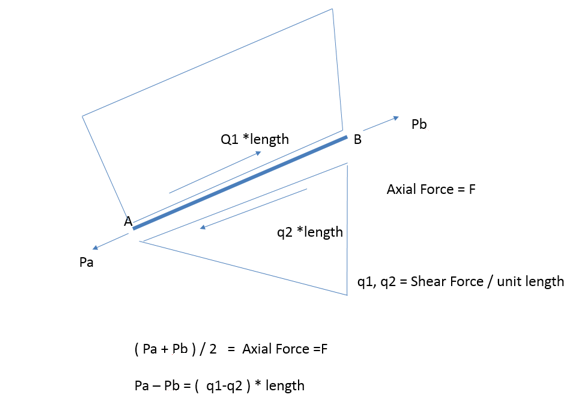
Figure 8. Output: Each Loadcase is Displayed in the Graphics Window for each Element
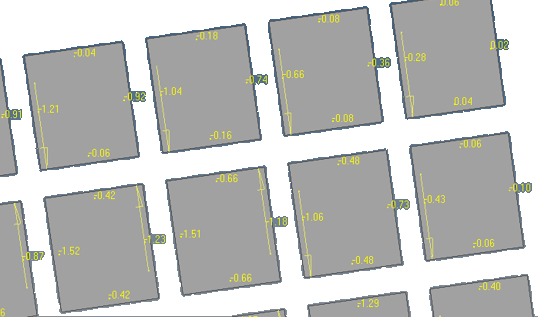
Figure 9. Shear Plot is Shown on Each Element Edge
Panel Load
A panel is a group of shell elements bounded by beams, T section and free edges.
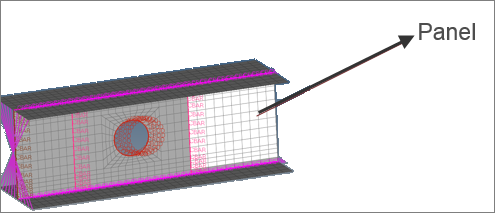
Figure 10.
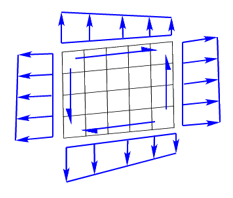
Figure 11.
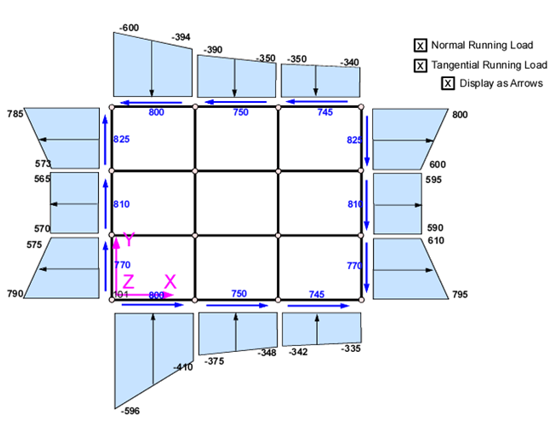
Figure 12.
-
Click Plot.
You can now cycle through the loadcases.
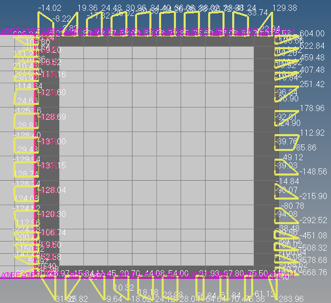
Figure 13.