S-Parameters
This option is only enabled when the Simulation Type is set to S-Parameters. Then, the user can visualize the calculated S-Parameters results for each defined coaxial feed antennas and for each user defined frequency.
Click on Show Results - S-Parameters menu and the S-Parameters panel shown in figure below is open.
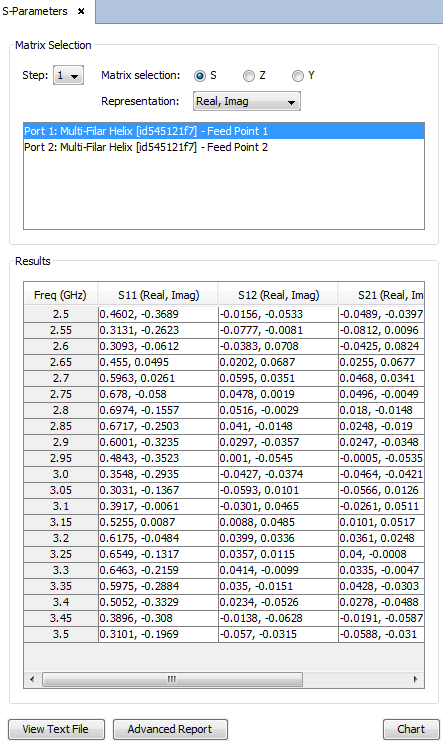
Figure 1. S-Parameters panel
The S-Parameters panel contains the following options:
- Matrix Selection:
- Step To select the geometric step in a parametric simulation. If the geometry does not contain any parameter, only one Step is available.
- Matrix Selection The results may be represented in
different magnitudes.
- S scattering parameters.
- Z impedance parameters.
- Y admittance parameters.
- Representation The results are represented as complex
values, given by different components and units.
- Real, Imag The Real and Imaginary parts are shown, in natural scale.
- Amplitude, Phase The Amplitude is given in natural format, and the Phase in degrees.
- db, Phase The amplitude, which is named dB, is given in logarithmic format, and the Phase in degrees.
- Ports section It shows all the available ports. When a port is selected in this list, it is selected in the geometry panel, so it is useful to identify where each port is placed.
- Results This section contains a table with the results represented in the format specified according to the Matrix Selection configuration. Each row in the table represents a frequency with all the parameters given by columns. Within the table, the results may be selected by columns for further plotting.
- Buttons below:
- View Text File Open a new tab panel with the table Results given in text file format. It can be exported by clicking on Save as... button.
- Advanced Report Open a new window with multiple options
to export all the results as a html file. The next
information may be edited:
- Output Matrices The results may be generated in one or all the magnitudes as mentioned above.
- Output Units The results may be generated in one or all the magnitudes and units as mentioned above.
- Frequency To select all frequency steps within a frequency sweep with the Export All Frequencies option, or just the desired one with the Export Single Frequency option.
- Step To select all geometric steps in the parameteric simulation with the Export All Steps option, or just the desired one with the Export Single Step option.
- Output Format To select the output format.
- Generate Click on this button to confirm the selected configuration and generate the output file. Then, the path of the output file is required.
- Cancel To close the Advanced Report window.
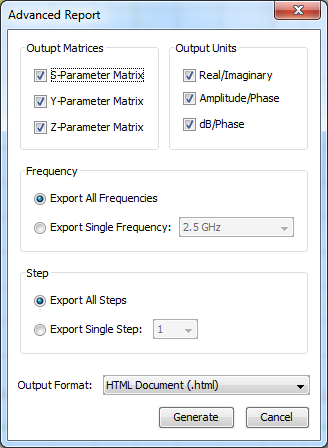
Figure 2. Advanced Report window
- Chart Click on this button to generate a 2D-plot with the selected row within the Results section. Every time that this button is clicked on, the new plots are included in the same graph.
Some examples of results representation are included in next figures.

Figure 3. S-Parameters plot
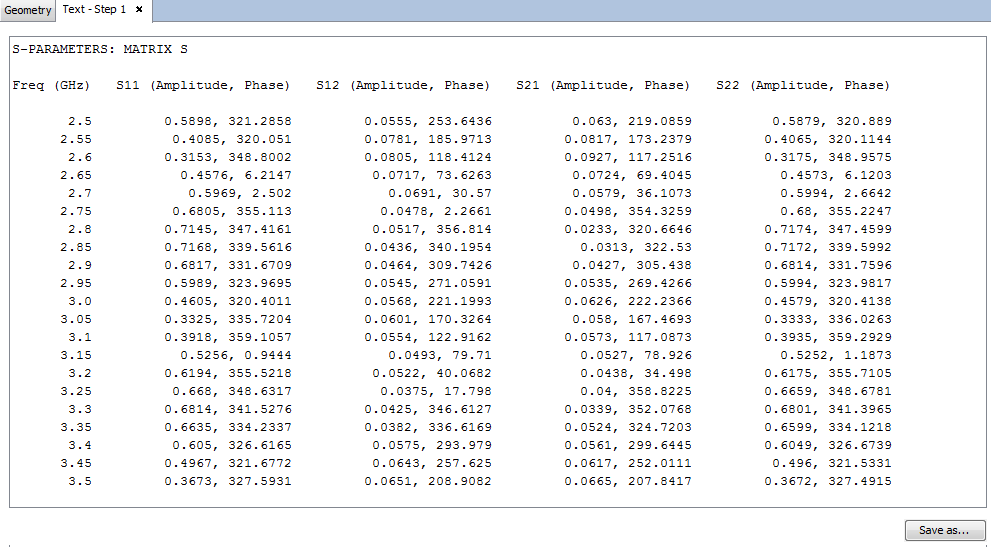
Figure 4. S-Parameters as text file
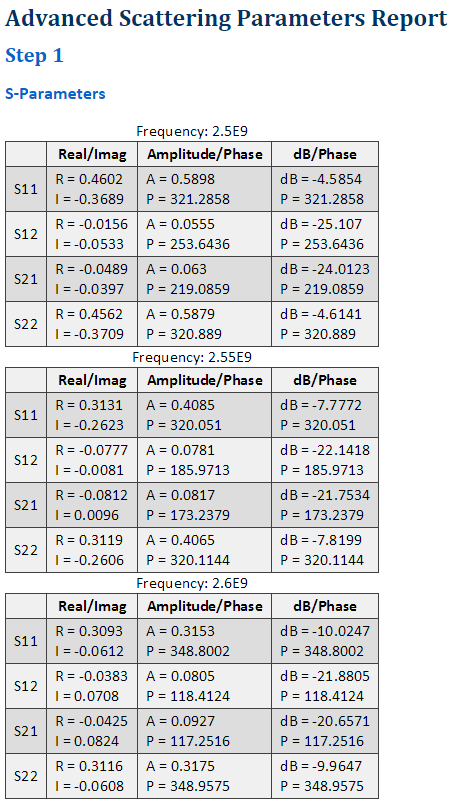
Figure 5. S-Parameters as html file