Scaling and Display Settings
A number of settings are available that affects how a result is scaled and displayed in a surface graph. These settings influences the colour scaling of the legend and displayed colour range.
On the Surface
contextual tabs set, on the Display tab, in the
Legends group, click the ![]() Individual range icon.
Individual range icon.
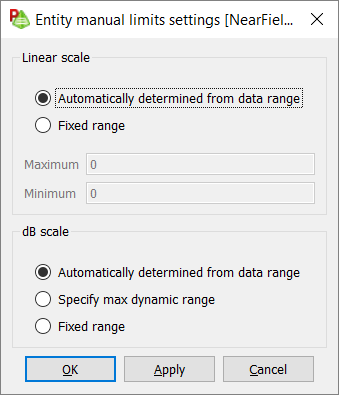
Figure 1. The Entity manual limits settings dialog.
Linear Scaling
For linear scaling, the following options are available to control the value range of the result:- Automatically determined from data range
- This option is applicable when you want the value range to clamp between the maximum and minimum values of the result.
- Fixed range
- This option is applicable when you want to specify the maximum and minimum values of the data range.
dB Scale
For dB scaling, the following options are available to control the value range of the result:- Automatically determined from data range
- This option is applicable when you want the value range to clamp between the maximum and minimum values of the result.
- Fixed range
- This option is applicable when you want to specify the maximum and minimum values of the data range.
- Specify max dynamic range
- This option is applicable when you want the maximum value of the result data to be
used as the upper limit for the legend values.
The minimum value of the result data is the maximum value of the result data minus the dynamic range value entered or the minimum value of the result data, whichever is larger.
Note: These settings affect the dynamic range limits.