Viewing the Far Field Results (2D)
View the far field results on a polar graph.
Since a full 3D set of data is requested in this example, 2D cuts can be extracted.
Create a new polar graph.
-
On the Home tab, in the
Create new display group, click the
 Polar
icon.
Polar
icon.
Add the far field result to the polar graph.
-
On the Home tab, in the Add results group, click the
 Far field icon. From the drop-down list, select
FarField1.
Far field icon. From the drop-down list, select
FarField1.
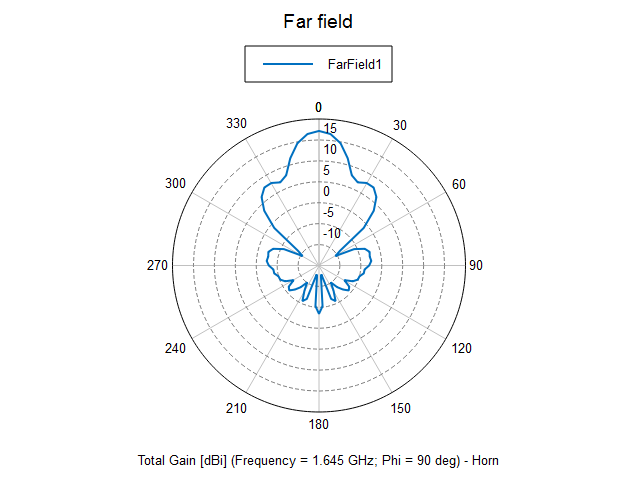
View the far field gain plotted in the YZ plane.
-
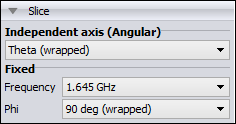
On the result palette, in the Slice
panel, make the following changes:
- From the Independent axis (Angular) list, select Theta (wrapped).
- From the Frequency drop-down list, select 1.645 GHz.
- From the Phi list, select 90 deg (wrapped).
-
View the total gain.