Envision supports various aggregation functions that may be used to aggregate the data along all the other dimensions that do not belong to Aggregation is essentially the mechanism of reducing the granularity of highly granular data. Although 'aggregation' suggests summation (SUM being the most common aggregation function), other typical aggregation functions include 'Average', 'Min', 'Max', 'Standard Deviation', and so on. Hence, 'aggregation' is also sometimes referred to as 'Roll-Up'.
Example
Envision's DNA lies in the ability to reduce the highly granular Fact table to a table of lower granularity by aggregating along the other dimensions.
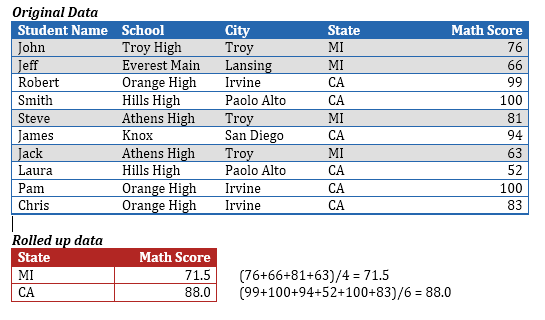
For example, let us consider a typical scenario where the average Math score of all high school students is being computed, where the original data contains the Math score of every student in every high school of every city in the United States. If you apply the function 'Average' as the aggregation function, the data that is originally highly granular is reduced to a single number reflecting the average math score of all the students.
In the above example, we have rolled all the way up to obtain a single number, but in most cases, you may want to roll up only to a certain level such as computing the average Math score of high school students grouped by geographic state. In this case, the Math scores of the students of each state will be aggregated independently, and the result is a value for each state.
In the above example, the original Fact table (blue table) is reduced to the lower red table by aggregating along the other dimensions such as Student name, School, and City.
Aggregation functions return a single value by aggregating multiple rows of data, over the set of possible records defined by the selection. It returns a single value by aggregating several records in the data, for example a sum or a count. Such aggregations are not pre-computed and stored. Envision performs these aggregations on-the-fly. If you drag and drop dimensions to build a visualization, the dimensions of the chart define the lower-level granularity to which the data needs to be aggregated. For example, in case of a Line chart, the X-Axis dimensions define the level to which the data is aggregated to the first lower-level (red table) granularity table.
Envision supports various aggregation functions that may be used to aggregate the data along all the other dimensions that do not belong to the final (lower-level granularity) table.
The supported functions are:
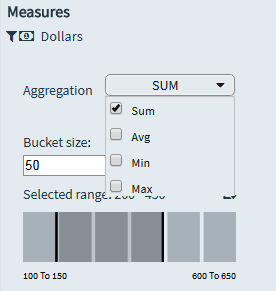
This function defaults to SUM with every measure defined in a chart, and the measure is rolled up to the chart level. It returns the sum of all values in the expression and can be used with numeric fields only. Null values are ignored.
For example, in case of a Line chart, the X-Axis dimension defines the level to which the measure is rolled up.
Syntax
SUM(arg1, arg2, ….)
Returns the minimum of the two arguments, which must be of the same type. Returns Null if either argument is Null. MIN can also be applied to a single field in an aggregate calculation.
Syntax
MIN(arg1, arg2, ….)
Returns the maximum of the two arguments, which must be of the same type. Returns Null if either argument is Null. MAX can also be applied to a single field in an aggregate calculation.
Syntax
MAX(arg1, arg2, ….)
Returns the average of all values in the expression.
Syntax
AVG(arg1, arg2, ….)
Returns the number of items in a group. Null values are not counted.
Syntax
COUNT(<expr>)
Returns the cumulative sum of the sequence.
Syntax
PROG(<expr>)
Returns the statistical standard deviation of all values in the given expression based on a given sample, for example, population.
Syntax
STDEV(<expr>)
Returns the statistical variance of all values in the given expression. It can be used with numeric type columns only. Null values are ignored while performing variance of an expression.
Syntax
VAR(<expr>)
Returns NULL and can be used for converting values where the denominator is zero. For example, the expression sum([dimension1])/ NULLIF( sum([dimension2]), 0) will compute to NULL if the denominator is zero.
Syntax
NULLIF( sum([dimension2]), 10)
For example, it is possible to have a number other than 0 in the second argument in the expression NULLIF( sum([dimension2]), 10). This means that if sum([dimension2]) is NULL use 10.
Some of the aggregation functions such as SUM, MIN, MAX, COUNT, and AVG can also be used in the formula of a derived dimension to achieve multi-level aggregation. For more information on how to use multi-level aggregation, see Understanding Multi-level Aggregation.