Connectivity in an Urban Scenario
Calculate the propagation results for an urban scenario with eleven stationary transceivers.
Model
The connectivity model represents a village area. Due to the level of detail in the buildings, it is called an urban scenario. Open the model with CoMan (Connectivity Manager).
Nodes
There are eleven stationary transceivers at different positions. The omnidirectional antennas function as transceivers, which are denoted “nodes”. Ten client nodes and a gateway node are defined in CoMan to analyze the connectivity of the network. All nodes of the network are listed on the Nodes tab on the System Configuration dialog.
Air Interface
Computational Method
Wave propagation computation is computed for all the nodes by selecting .
In this model network predictions are computed for a horizontal prediction plane at a height of 1.5 m. The height of this plane is set on the Prediction tab.
Finally, connectivity is determined by clicking .Results
Propagation results are computed for field strength and power for all the nodes and can be viewed at Connectivity_Example_Urban\results\propagation.
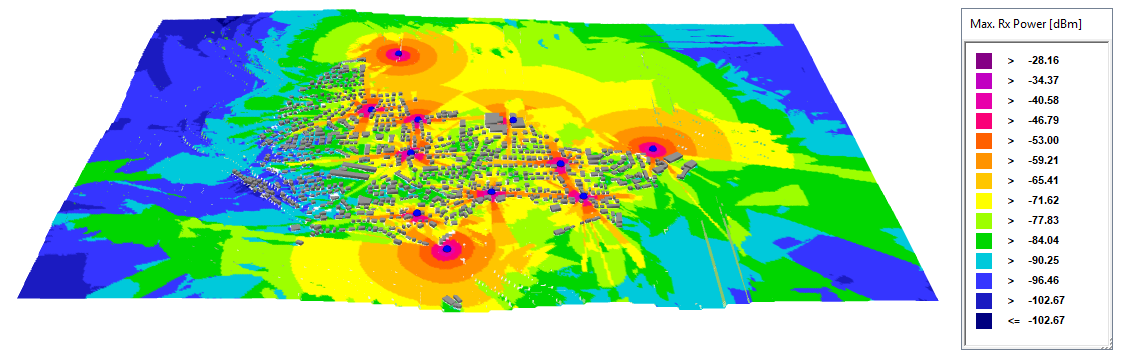
Figure 1. The maximum received DL power.
The connectivity between nodes can be viewed at Connectivity_Example_Urban\results\network. To view the connectivity between the nodes, activate Show Paths, and click on one of the nodes.
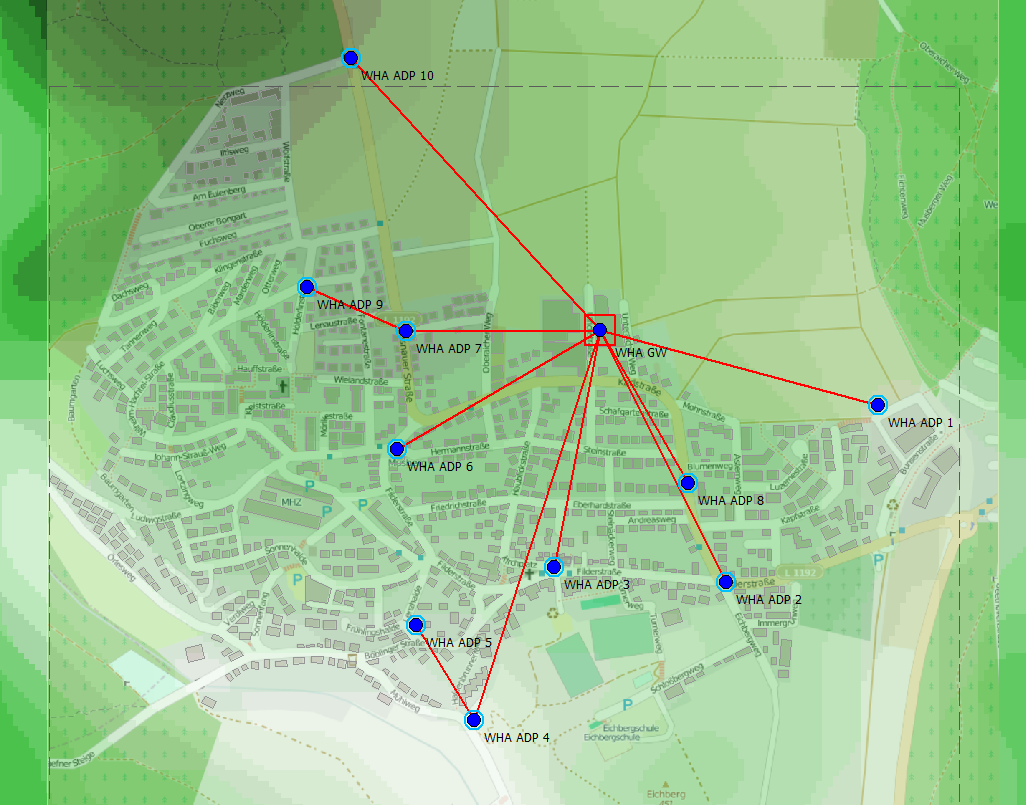
Figure 2. The connectivity between the nodes.