Create a Dashboard Using Data from AnythingDB

Important: To visualize data stored at the Raw History section in AnythingDB, or the data stored in a collection, you will first need to create an app. If not, skip Step 1 and begin at Step 2.
  1. Optional: Click Access Control > Apps and create a new App by following these steps.
    Note: The Application Client ID and Secret ID is required in configuring the New Workbook in Real time Vizualization module. Be sure to capture and save this information.
  2. Click Real Time Visualization > Workbooks.
  3. Select a folder to work in. By default a root folder with your username has been created. Right click to see the different operations you can perform.
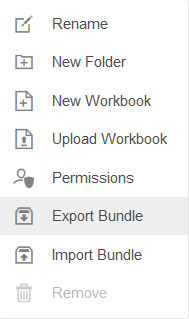

    Figure 1.
  4. Click New Workbook.
  5. Enter a name for the Workbook and click Create.
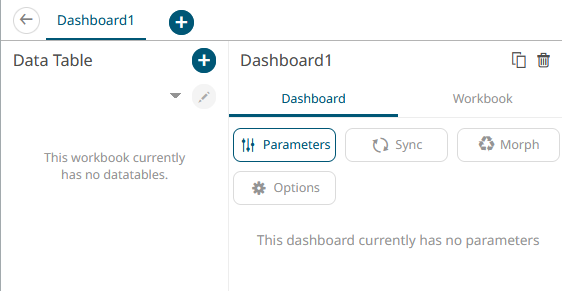

    Figure 2.
  6. Create a Data Table by clicking the + icon.
    Data tables define the queries and source data repository definitions, in order to retrieve data.
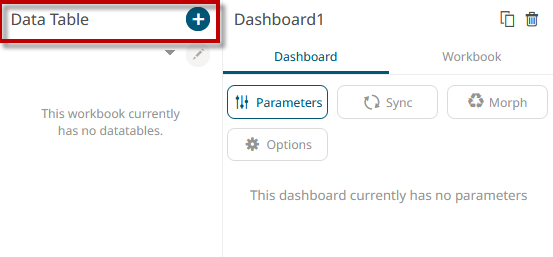

    Figure 3.
  7. Under Data Table Settings, enter a title and click the check mark to save it. Enter a description, if desired.
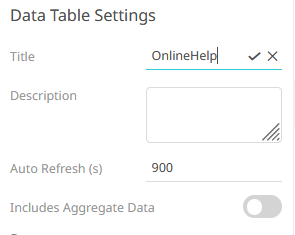

    Figure 4.
  8. With Data Sources highlighted, select any of the connectors available.
    For retrieving data stored in AnythingDB, use the Json connector under the File/URL column. The JSON connector allows the retrieval and processing of JSON files, either from a disk, a text, or as in this case, from a defined URL.
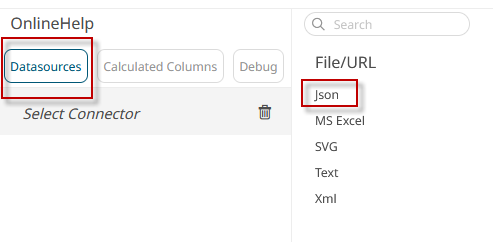

    Figure 5.
  9. In the Plugin section, enter the following:
    1. JSON File Source: select Web URL.
    2. Authentication Type: select OAuth
    3. Token URL: enter https://api.swx.altairone.com/oauth2/token
    4. Token Request Body:
      This is retrieved from the app created earlier, if applicable:
      client_id=enter-the-app-id-created-in-step-1&client_secret=enter-the-client-secret-from-step-1&grant_type=client_credentials&scope=thing
    5. Path: Create a path URL using the AnythingDB API Reference.
      • To retrieve the things status of a collection:
        https://api.swx.altairone.com/spaces/YourSpaceID/collections/YourCollectionName/things-status
      • To retrieve the data stored at the raw history section of a single thing:
        https://api.swx.altairone.com/spaces/YourSpaceID/data/?source[]=thing_id&limit=1000
    6. Click Generate Columns.
    7. Edit the column name and format as required.
    8. Click Refresh Preview.
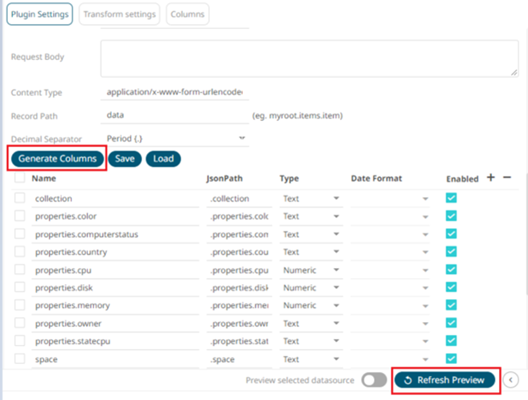

      Figure 6.
  10. Click Save.
  11. Click back to return to the Edit Dashboard view.
  12. On the blank canvas (right half section), sketch a simple square clicking and dragging on the blank interface.
    This enables the Visualization menu.
  13. Select the Visualization and configure it using the Visualization settings.
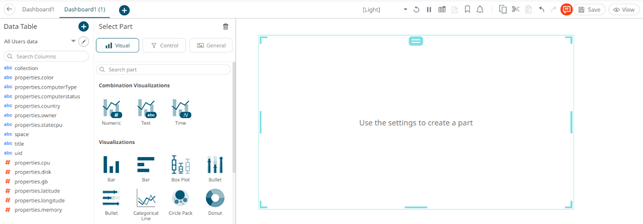

    Figure 7.