


|
Time Series Surface Plot
Time Series Surface Plots are used to identify trends and outliers within Time Series surfaces, typically forward curves across time.
The Surface is made up of a series of points where each point has:
q Time Position
q Y Position
q Color (which represents the Z axis).
The color scale can be continuous or stepped to show a surface gradient.
The below figures show an Oil Futures forward curve, with prices relative to the front month.
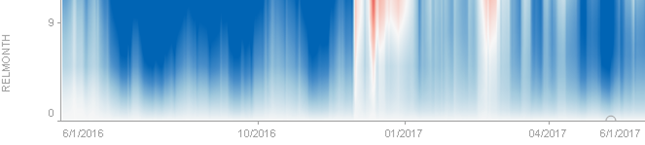
Figure 2-35. A time series surface plot with continuous colors.
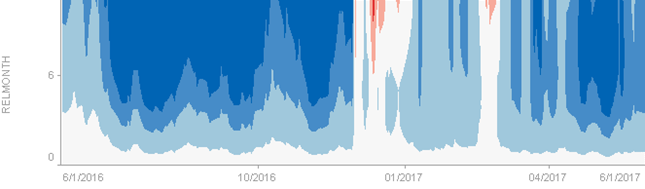
Figure 2-36. A time series surface plot with stepped colors