|
Time Window Filtering
Time-series visualizations can be filtered to show a specified time window, through the Time Filter box.
NOTE: Only one can be added per dashboard.
Adding a Time Filter Box
-
Draw a rectangle on the dashboard canvas to display the Parts dialog.

-
Click the Time Filter Box
 icon in the in the Legends
& Filters section of the Parts
dialog.
icon in the in the Legends
& Filters section of the Parts
dialog.
This is a container for a Time Filter and works in a similar way to the standard Filter Box.
-
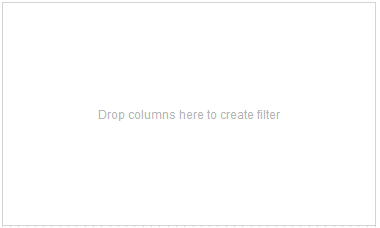
By default it appears empty and without a defined border. You will see this prompt: Drop columns here to create filter
-
-
Drag and drop a Time Series column from the Data Table list to the Time Filter Box.
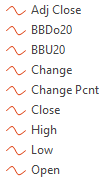
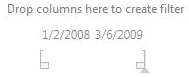
As the column is dragged over the Time Filter Box a draft representation of the filter is presented in gray.
-
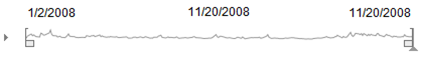
Release the mouse to add the column to the Time Filter Box.
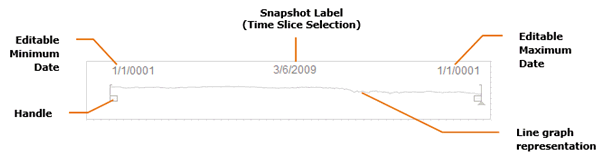
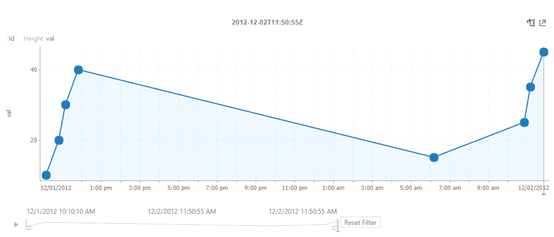
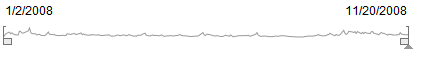
You will see:
-
-
Editable Minimum Date
-
Editable Maximum Date
-
Handles for quick filtering of the time period
-
Time Slice Selection (Snapshot Time)
-
Line Graph representation of the Time Series column
-
-
You can drag other Time Series columns over to the Time Filter Box. This will replace the existing column in the Time Filter Box. A Time Filter Box can contain only one Time Series column.
-
The Time Filter Properties are accessed by clicking Settings.
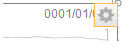
This opens the Time Filter Box Settings dialog.
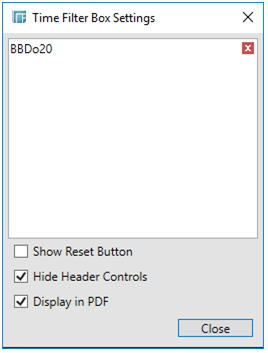
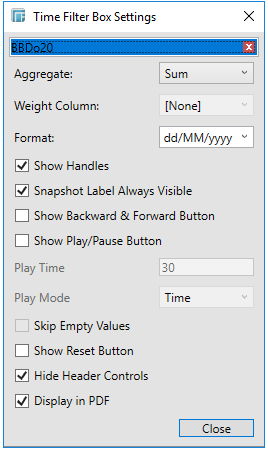
Click the Time Series column to display or define its settings.
-
-
Aggregation method for selected Time series variable.
-
-
If you set the aggregation method to Cumulative Sum, Cumulative Sum By Max, Percent of Weight Total, Ratio, Weighted Harmonic Mean, Weighted Mean, or Weighted Sum, the Weight Column is enabled that allows you to select the weight column to use.
-
If you set the aggregation method to PercentofTotalChange the Reference is enabled and displays a list of numeric data columns in the selected data table.
-
-
Display Format for dates/times
-
Whether to Show Handles
-
Whether the Snapshot Label is always visible. Default is True.
-
Whether to Show Backward and Forward Buttons

-
Whether to Show the Play/Pause Button

-
How long the Play Time will run if Play Mode is Ticks
-
Whether the Play Mode will be Time or Ticks
-
-
Setting to Time will playback the time slices as quickly as possible
-
Setting to Ticks will playback a time slice based on the set Play Time. For example, there are 8 time slices in the Time Series visualization (Line Graph), setting the Play Time to 16 will playback a time slice per 2 seconds (i.e., will move the snapshot one step per 2 seconds).
-
-
-
-
-
Whether to Skip Empty Values when the Play Mode is Ticks
-
Whether to Show the Reset Button
-
Whether to Hide Header Controls
-
Whether to Display in PDF
-
The Show
Handles property is checked by default.
Un-checking this option removes the Time Window handles, so that the time filter only displays the range and the snapshot time.
The Snapshot Label Always Visible property is checked by default:
Un-checking this option removes the snapshot label.
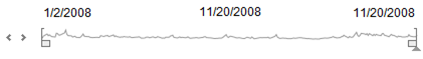
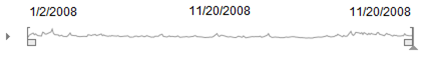
The Show Backward & Forward Button option adds the ability to move through the time slices by using the Back or Forward button.
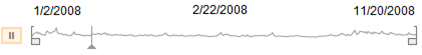
The Show Play/Pause Button option adds the ability to automatically play through all the time slices.
-
Click on the Play
 icon. The
icon swaps to Pause
icon. The
icon swaps to Pause
 and the snapshot time moves to the first time slice.
It subsequently automatically moves through each time slice until it reaches the end of the time window, causing the playback to reset.