


|
Adding a Shape Legend
Shape Legend displays the shape variables of the associated visualization (Scatter Plot, Table, Timeseries Combination, and Timeseries Scatter Plot). You can also set the orientation or enable the ability to do a filter or to display this part in the PDF output.
1. After double-clicking or drawing a rectangle
on the dashboard canvas, click  on the Select Part pane
then click the Shape Legend
on the Select Part pane
then click the Shape Legend  icon.
icon.
The Shape Legend Settings pane is displayed, and the Shape Legend part is added on the dashboard canvas.
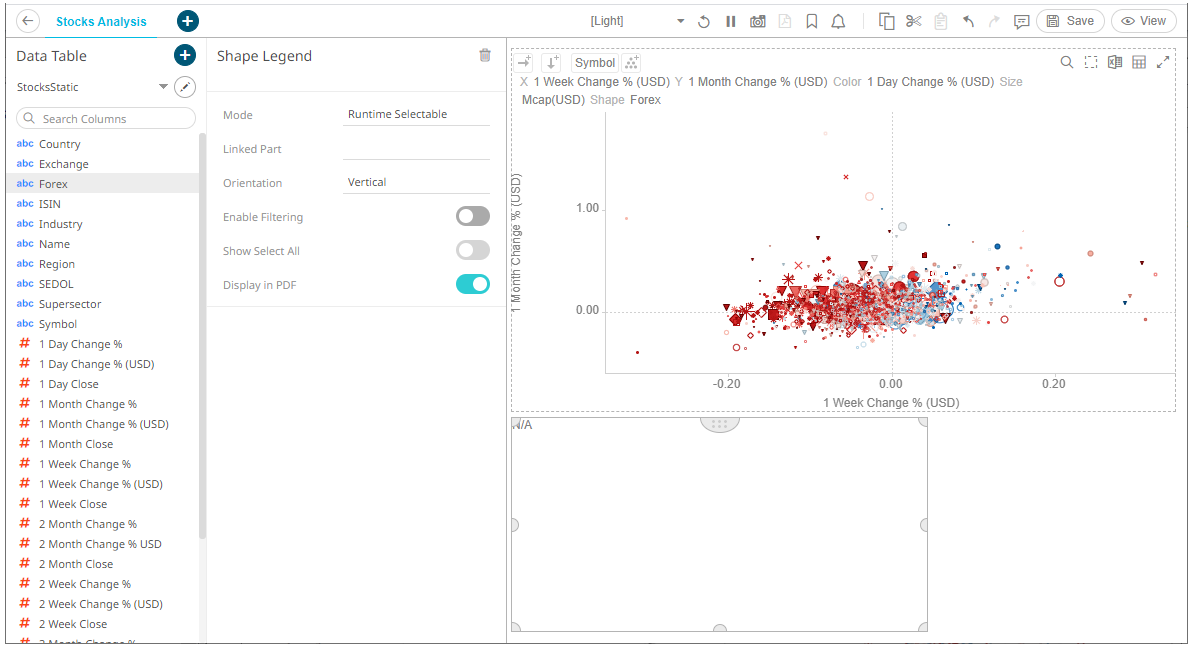
2. Select the legend Mode:
· Runtime Selectable
This mode is only applicable when connecting to a timeseries combination graph.
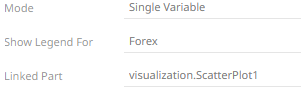
· Single Variable
Sets the shape legend to a specific source column of a parent visualization.
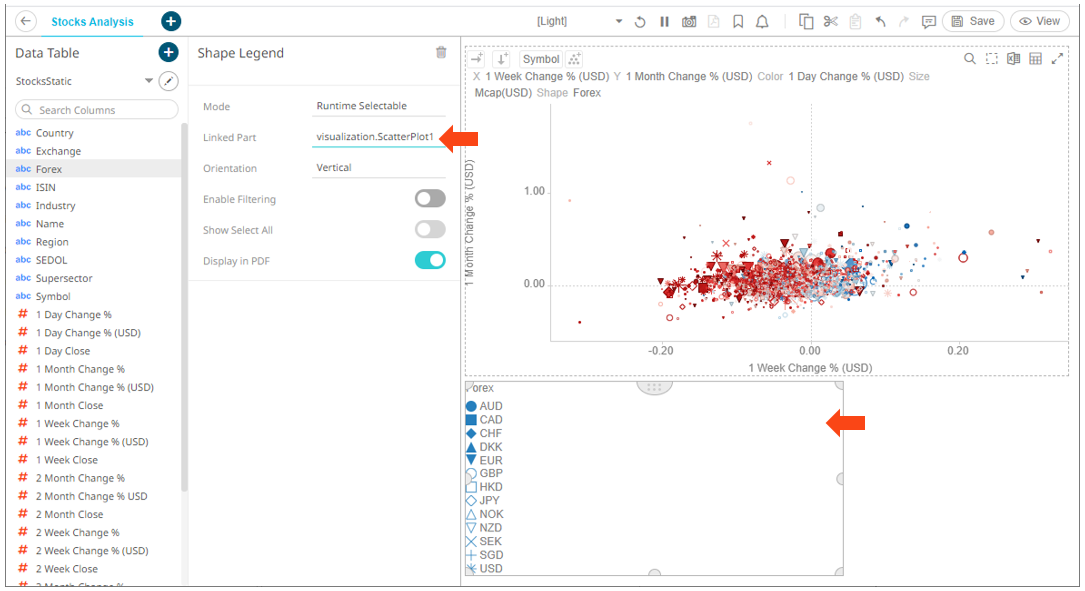
3. Select from any of the available parent visualizations with shape variable from the Linked Part drop-down list.
The shape legend is now connected to its parent visualization. It will retrieve shape variables from this visualization and display them in the legend on the dashboard.
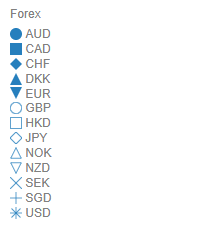
For the Single Variable mode, the Show Legend For field is automatically filled with the column of the shape variable in the parent visualization.
For the Runtime Selectable mode, this automatically maps all of the shapes of the timeseries combination graph to the legend.
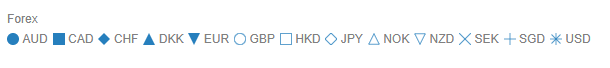
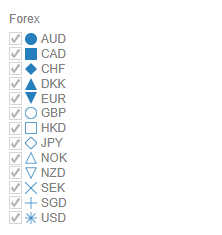
4. For test shape legends, you can display them either:
· Vertical
· Horizontal
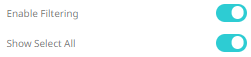
5. Enable filtering and allow selection of all items (Show Select All):
6. Tap the Display in PDF slider to turn it on and include this dashboard part in the PDF output.
7. Click the Save  icon on the toolbar to save the
changes.
icon on the toolbar to save the
changes.
When
saved, the  notification is displayed.