


|
Order Book Graph Settings
The Order Book Graph displays an aggregated order book of prices and associated sizes across time. For each time slice, it displays:
q Price (as Height)
q Tick Size (as Size)
q Order Size (as Color)
q Duration of Aggregated Orders at a given price (time period)
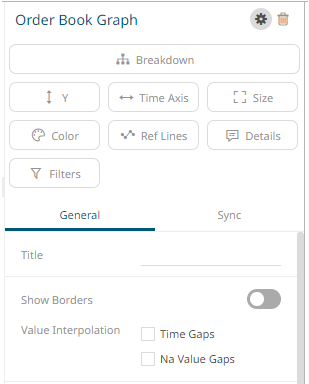
The order
book graph settings pane is displayed after clicking the Settings
 icon
or the Visualization Title (i.e., Order Book Graph):
icon
or the Visualization Title (i.e., Order Book Graph):
|
Setting |
Description |
|
Show Borders |
Determines whether a border is drawn around each bar. |
|
Interpolate Across Time Axis Gaps |
Determines whether time axis gaps (Working Week/Time) are interpolated. |
|
Interpolate Across Na Value Gaps |
Determines whether Na value (or missing) gaps are interpolated. |
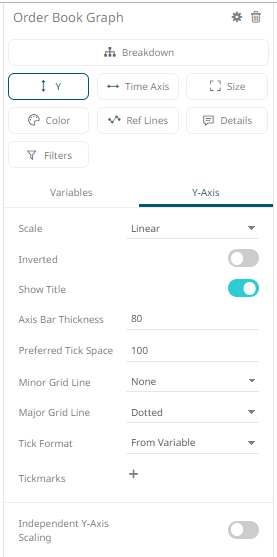
Other visualization-specific properties can be set by clicking on the Y-Axis variable drop area and then selecting the Y-Axis tab:
|
Setting |
Description |
|
Independent Y-Axis Scaling |
Determines whether to have each visualization Y-axis in a cross tab automatically scaled independent of the others. |