|
Waterfall Chart Settings
Waterfall Charts are a form of cumulative Bar Chart, showing the cumulative effect across a series of changes.
They can aid in the understanding of how performance changes contribute to a final position.
Color can be used to represent either a Stage in the process, or the change in performance for that stage.
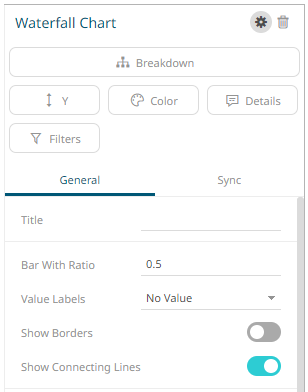
The waterfall
chart settings pane is displayed after clicking the Settings
 icon
or the Visualization Title (i.e., Waterfall Chart):
icon
or the Visualization Title (i.e., Waterfall Chart):
|
Setting |
Description |
|
Bar Width Ratio |
Defines the ratio between Bars and the space between the bars. |
|
Value Labels |
Defines what type of value labels are shown in bars: Bar Value or Cumulative Value. |
|
Show Borders |
Determines whether borders are drawn around bars. |
|
Show Connecting Lines |
Determines whether connecting lines are drawn between bars. |
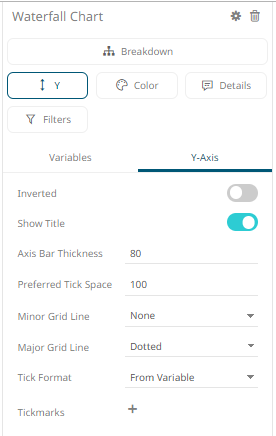
Other visualization-specific properties can be set by clicking on the Y-Axis variable drop area and then selecting the Y-Axis tab: