


|
Map Plot Settings
Use Map Plots to display geographic data, where you have longitudes and latitudes associated with individual data points. These plots clearly show data correlations and clustering that is geographic in nature.
In a Map Plot, the visualization expects Latitude and Longitude measures to be associated. It will then retrieve from the selected map tile provider the appropriate background map to display under the data points. This background map is constructed by retrieving individual map tiles at set zoom levels.
As the background map is provided automatically, it relies on:
q A range of supplied longitudes & latitudes to provide a bounding area
q An active Internet connection to retrieve the map tile images
Panopticon ships with a number of cross reference datasets to determine the appropriate latitude/longitude for datasets. These have been provided through subsets of the data available at GeoNames.org. ( http://www.geonames.org )
More detailed geo-coding data is available from this website, and many others.
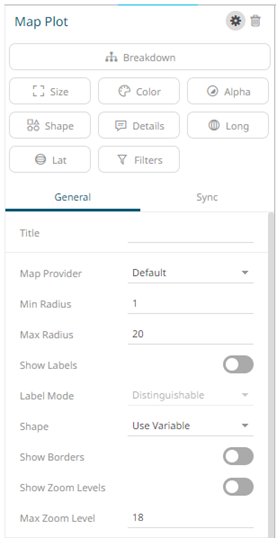
The map plot
settings pane is displayed after clicking the Settings  icon
or the Visualization Title (i.e., Map Plot):
icon
or the Visualization Title (i.e., Map Plot):
|
Setting |
Description |
|
Map Provider |
Determines which Map Provider should be used for providing Map tiles. Initially only a single map provider is defined, but more can be added by modifying the configuration. |
|
Min Radius |
The minimum radius in pixels of the data point. |
|
Max Radius |
The maximum radius in pixels of the scatter point. |
|
Show Labels |
Determines whether labels will be displayed. |
|
Label Mode |
Enabled when Show Labels is checked. This property determines how data point labels are shown. Values can be: · Distinguishable · All |
|
Shape |
The shape of the scatter point. This can be: · Filled Circle · Filled Square · Use Variable |
|
Show Borders |
Determines whether a border is drawn around each data point. |
|
Show Zoom Levels |
Determines whether a zoom level indicator should be displayed on the Map Plot. |
|
Max Zoom Level |
The maximum zoom to be applied when there is a single data point, rather than a collection, so a latitude / longitude bounding box cannot be established. |