


|
Table Visualization Axis
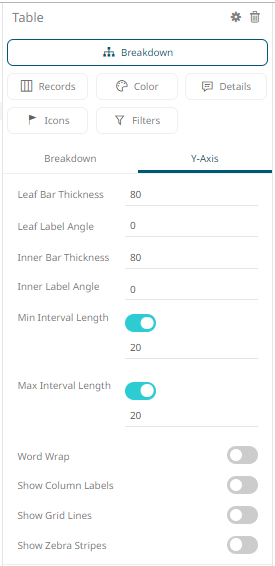
The Y axis of the Table visualization includes the following settings:
|
Setting |
Description |
|
Leaf Bar Thickness |
The thickness of the leaf or lowest level of data. Default is 80. |
|
Leaf Label Angle |
The Label angle of the leaf or lowest level of data. Default is 0 and maximum is 90. |
|
Inner Bar Thickness |
The width or height allocated for the non-leaf components of the Table axis in pixels. Default is 80. |
|
Inner Label Angle |
The angle of the non-leaf labels. Default is 0 and maximum is 90. |
|
Min Interval Length |
The minimal interval in pixels between cross tabbed visualizations. Default is 20. |
|
Max Interval Length |
The maximum interval in pixels between cross tabbed visualizations. Default is 20. |
|
Word Wrap |
Determines whether to wrap the visualization axis text. |
|
Show All Column Levels |
Determines whether the space in the text axis should be allocated to all hierarchy levels, whether visible or not. |
|
Show Column Labels |
Determines whether column labels are visible or not. |
|
Show Grid Lines |
Determines whether grid lines are visible or not. |
|
Show Zebra Stripes |
Determines whether to display alternating row colors (like zebra stripes) in the table. |
|
Leaf Bar Thickness |
The thickness of the leaf or lowest level of data. Default is 80. |
|
Leaf Label Angle |
The Label angle of the leaf or lowest level of data. Default is 0 and maximum is 90. |