


|
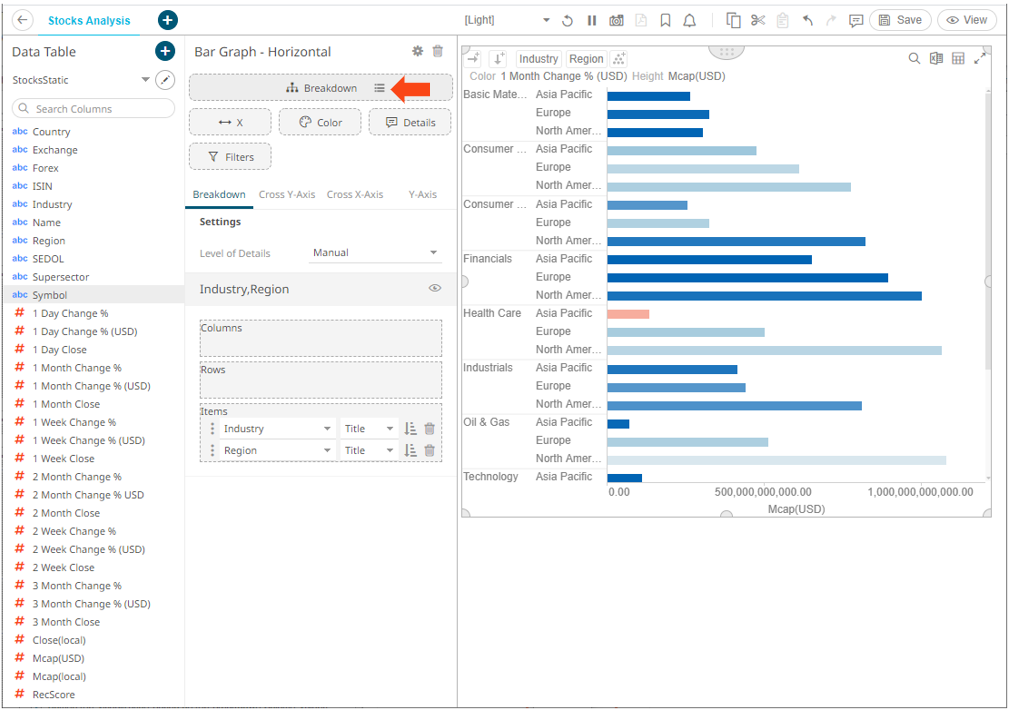
Adding Breakdowns
You can define several breakdowns for a visualization.
Steps:
1. Drag and drop text columns from the
Data Table pane to the Breakdown  drop area on the Visualization
Settings pane.
drop area on the Visualization
Settings pane.
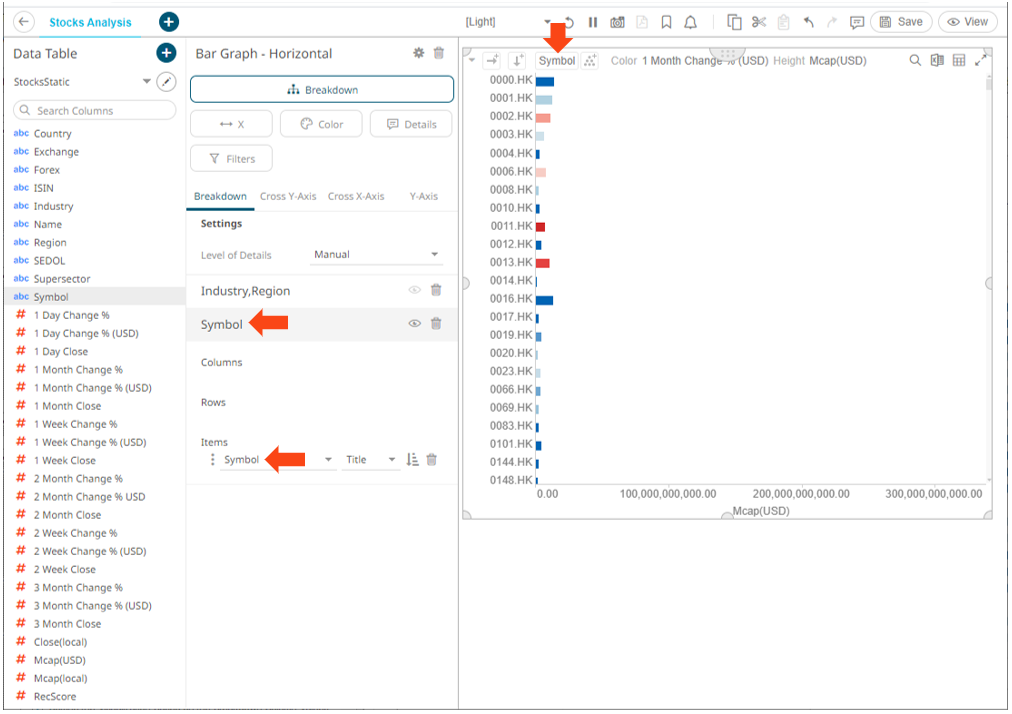
A new
breakdown definition is added under the Breakdown tab (Symbol)
with the View  icon turned
on. Also, the breakdown column is added on the Breakdown section
of the visualization.
icon turned
on. Also, the breakdown column is added on the Breakdown section
of the visualization.
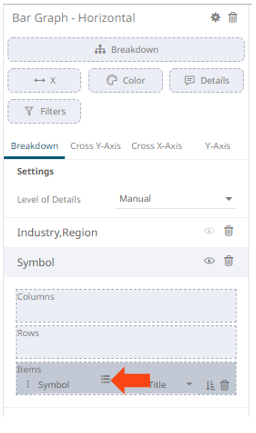
2. To add more breakdown levels, drag more text columns to the Items drop area.
This will break apart the aggregated data further into separate bars and the column is added under the Items drop area of the breakdown and Breakdown section of the visualization.
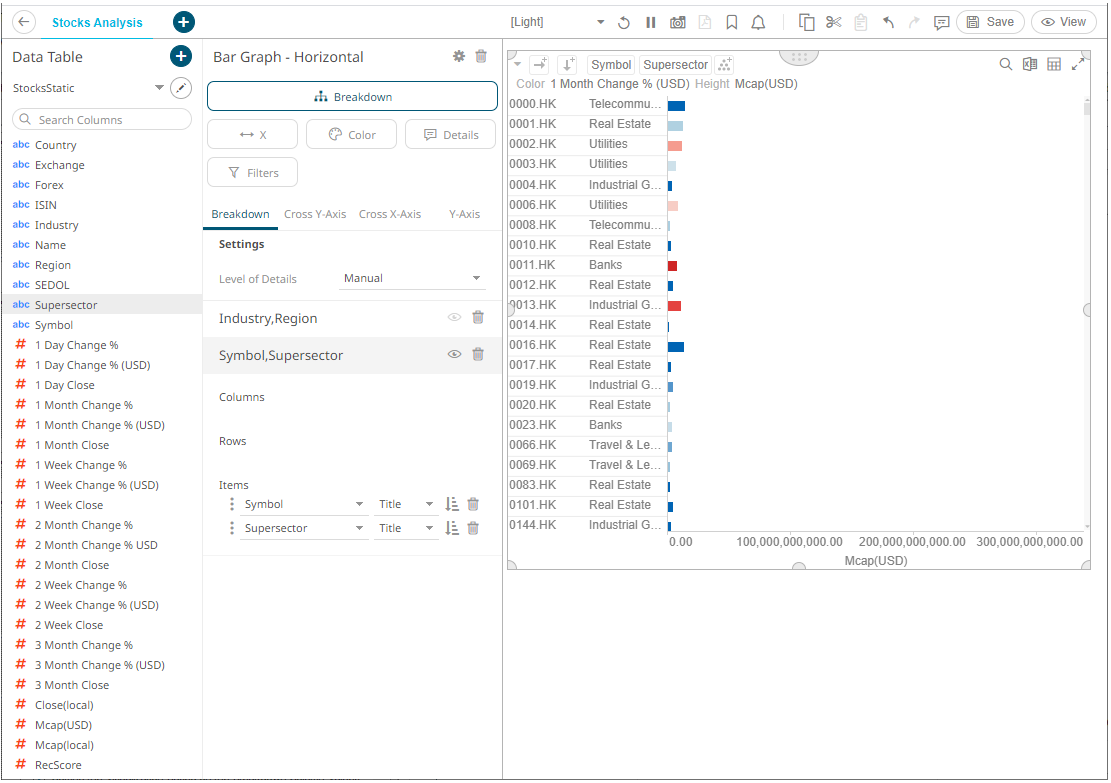
You can have as many levels in the breakdown as you like, although best practice is to limit the hierarchy to five or fewer levels.
3. Click the Save  icon on the toolbar.
When
saved, the  notification is displayed.